William J. Hudson’s Pocket Transit History Site

Several times in this blog I’ve referenced an excellent pocket transit history site established by a gentleman by the name of William J. Hudson.  His site was the resource for historical information on the development of the pocket transit, its many variations and changes down through the years.  I considered it the best resource on pocket transits available anywhere on the web.

Unfortunately it looks like Mr. Hudson’s site went off-line well over a year ago.  I first noticed it about six months ago while doing some research on a pocket transit I had just added to my collection.  Over the last few months I’ve been contacted several times either directly or through this blog about Mr. Hudson’s site, asking if I knew when it might be available again.  Since I don’t know Mr. Hudson and I’ve never communicated with him I had no way of contacting him to see when or even if he intended to reestablish his website.  It seemed a great resource for those interested in pocket transits was gone from the web forever.

Well, things don’t really disappear from the web.  They just get archived.  I’m happy to report that I’ve stumbled upon an archive of the main page of Mr. Hudson’s site hidden away in a dark corner of the internet.  Unfortunately none of the linked pages such as his serial number breakdown page were archived, so that resource appears lost.  But the main page is still chock full of useful information about the pocket transit’s history, development and features.

I’ve linked to the internet archive for this page from the image below.  When you open the page you’ll have the option to download the page and graphics as a zip file.

Click here to access the site archive

I’m glad to have access again to at least a portion of this great resource.  Mr. Hudson, if you read this, can we have your site back please?  Hundreds a couple of diehard pocket transit collectors really miss the information your site provided!

Brian

A Tale of Two Trimbles

Earlier this year Trimble released its newest generation of the Juno data collectors to the market.  Unlike the previous generations of these devices (the original Juno S and the later Juno 3 series), the new Junos come in several different flavors depending on which business line within Trimble you purchase yours from.  Those purchased through Trimble Mapping & GIS distributors are labeled the Juno 5.  Those purchased through Trimble’s Mobile Computing Solutions distributors are known as the T41.  They are all based on the same hardware platform.

To confuse things even more, you can get either device running different operating systems, either Windows Embedded Handheld 6.5 (aka, Windows Mobile) or Android 4.1.

Back in May my organization got its hands on a loaner 5D unit and I was initially impressed with the hardware but thought the Windows OS was holding the whole package back.  At the time I viewed it as an outstanding piece of hardware saddled to an operating system that badly limits the unit’s performance and potential.  I was eager to get my hands on the T41, hoping that the current version of Android would unlock a lot of the performance potential of this device.  About a month ago my organization purchased one 5D and one T41 to test.  We were looking for an upgrade to our Juno 3D handhelds (very good devices, by the way) and were intrigued by the possibilities of the Android-based Juno T41; something we could run the ESRI ArcGIS and Collector apps on along with Trimble’s new TerraFlex app.

The 5D (left) and the T41 (right)

When we received the units and began to test them I made a number of quick observations.  As I initially wrote back in May, the hardware is first rate. From the smartphone form factor to processor speed to screen resolution and clarity under a wide variety of conditions to the GPS module performance.  This is a seriously good piece of hardware.  Back in May I complained that the 5D lacked the ability to receive signals from the Russian GLONASS system.  I still feel it’s a shortcoming of the unit, but in actual use it may not matter.  The overall performance of the GPS receiver in these new Trimbles is outstanding, with fast acquisition and the ability to hold signal lock under some very tough conditions like under full tree canopy cover.  The GPS performance is so good I’m not (too) bothered by the lack of GLONASS capability.

One feature we did not test, and probably never will, is the 5D and T41 performance as an actual cell phone. While a cell phone data plan would greatly enhance the usefulness of these devices our organization is not willing to pay the cost to get these units activated as cell phones.

Where the 5D and T41 stumble are the operating systems.  I’ve already touched on my issues with the Windows OS in my earlier posting, but let me expand a bit here.  I understand why developers like Trimble stick with Windows Embedded Handheld.  Trimble has over a decade of experience developing for the Windows Mobile environment.  Most of their field data collector and survey system software like TerraSync was developed specifically for the Windows Mobile environment.  I get it. Windows Embedded Handheld (WEHH) is stable and well understood and has proven itself in enterprise environments.  So has Windows XP, and like XP WEHH isn’t getting any better with age.

It must be a terrible time to be an enterprise mobile software developer working in the Windows environment.  Microsoft is starting to release Windows 8 for mobile devices similar to the Juno, but by necessity these devices must connect with a compatible desktop computer for data transfer and application updates. Windows 8 on the mobile device isn’t backwards compatible with earlier versions of Windows on the desktop, yet corporate America has yet to embrace Windows 8 and will likely be sticking with Windows 7 for several more years.  What’s a developer to do? In Trimble’s case they stick with what they know and what their customers seem to be demanding – don’t give me anything I can’t sync with Windows 7.  The problem with WEHH on the Juno 5D is that the software can’t seem to take full advantage of what the hardware offers.  It’s like putting square wheels on a Ferrari.  This comes to light when working with the 5D’s camera.  The camera is a very good 8 megapixel unit with dual flash.  It takes great pictures.  Too bad the WEHH camera control software sucks. It’s slow, difficult to configure and the controls are not intuitive.  It’s like working with an early Windows CE-based smartphone, which is essentially what you have with the 5D running WEHH.  The issue of hardware ‘throttling’ really comes to light when you compare this 5D camera experience with the camera on the T41 running on Android 4.1. The camera experience on tht T41 is entirely different and far more satisfying because Android does a much better job of interfacing with the camera.  It’s like you are working with an entirely different camera hardware module but it’s really an OS performance issue.

Before moving away from the discussion of WEHH I do have to add that the performance of enterprise apps like TerraSync and ArcPad is very good on the 5D.  Everything works as advertised, and the additional processing power of the 5D along with the larger screen size and improved resolution (over the Juno 3-series devices) makes for a great experience in the field.  The new Trimble SatViewer application is also a great improvement over the old GPS Controller module found on other Trimble WEHH devices.

Now on to the T41.  While the performance of the 5D was something of an expected disappointment, the performance of the T41, and Trimble’s vision of how the T41 fits into their overall product line, comes as an unanticipated and surprising disappointment.

I’ll leave aside any discussion of the T41 hardware – everything good I’ve discussed about the 5D hardware applies to the T41.  Bottom line – the hardware is great.

At first glance Trimble’s choice of operating system is also great.  The unit comes pre-loaded with Android 4.1.  I’m testing Android 4.2 on a Google Nexus 7 tablet and I’m about to admit that this version of Android is good enough to pull me away from my beloved iOS devices.  Android is not an ‘enterprise’ OS and can’t run applications like TerraSync or ArcPad, but there are a number of very good lightweight apps like ESRI’s ArcGIS and Collector apps and Trimble’s own TerraFlex app that uses a cloud data storage paradigm.

The problem is that the T41 comes with Trimble’s in-house version of Android 4.1.  It was developed using the open source version of Android and has not been certified under the Android Compatibility Program.  This means that the T41 can’t get access to the Google Play Store for installation of any one of the thousands of Android apps available through that environment.  This includes ESRI’s ArcGIS and Collector apps and even Trimble’s own TerraFlex app.  Not even Google’s own Google Maps, Google Earth or the GMail app can be installed on this device!  This is a serious oversight.  I know plenty of surveyors and GIS professionals who depend on Google Maps and Google Earth on smartphones to support things like work crew routing, initial survey reconnaissance, survey control recovery and other tasks, and use programs like Google Drive to access project documentation in the field.  There’s also no reason you shouldn’t be able to use GIS apps like ESRI’s ArcGIS and Collector apps on this device.

Trimble’s decision to not get this operating system certified is baffling.

No Android Compatibility
certification means
no Google Maps,
no Google Earth,
no native GMail support,
no Google Drive support,
no ESRI or Trimble app support
and the list goes on…

Worse yet, Trimble makes regular mention of the Trimble App Store in their product documentation and even includes the link to this app store on the T41 when they ship the unit.  The problem is, other than two crippled Trimble apps – the free versions of MyTopoMapViewer and Terrain Navigator Pro – there’s nothing else in this app store. You can download apps to this device from the Amazon app store, but most of the apps available there are either older versions of what’s available on Google’s app store or are formatted specifically for Amazon’s Kindle devices.

Trimble App Store icon
What’s in the Trimble App Store?
Not much

I honestly thought I was missing something here.  Surely Trimble has something better for the T41 that I just couldn’t get to.  Perhaps a real app store that I just needed the right permissions to access or a software upgrade that would allow me to link to the Google Play Store.  My local distributor put me in touch with Trimble’s Mobile Computing Solutions (MCS) tech support and I quickly found out that no, what I got is all there is.

Apparently Trimble views the T41 as an ‘enterprise only’ unit.  This means enterprises have to develop their own specific apps for it using the Trimble Android SDK.  This is an OK approach, but there is still no reason to not have the OS version certified by Google.  It’s just stunning to think that Trimble would ship an Android-based data collector that can’t access Google Maps, Google Earth or even run Trimble’s own Android-based data collection app!

I have heard rumors that Trimble is re-thinking this approach to the T41 and may be working to get its version of Android certified by Google.  If and when this will happen I don’t know – Trimble MCS hasn’t been very forthcoming on the topic.

So where does this leave us when considering the 5D and the T41?  Taking into account the unit cost (about $1,800 each) and the operating system issues shared by both of these devices I have to say that they are not worth the investment, particularly when you consider that Trimble still offers a very capable handheld unit – the Juno 3D – at about half the cost.

If Trimble releases a version of Android that allows access to the Google Play Store I’ll come back and do an updated review, but for now I simply can’t recommend either of these devices.

Brian

Thinking in 3D

This week at work, just for fun, I set up a stereoscope and slid some stereo photos underneath the mirrors. These photos are high resolution, large scale shots taken back in April when we had a new orthorectified aerial image of the airport developed.  I asked the contractor to send me a stereo pair from the project that I could play around with.  It’s been years since I spent any time peering though the optics of a stereoscope and it was fun to look over the images and realize just how much a stereo view adds to one’s ability to pick out details.

There was a time when analyzing stereo images was a critical skill in my field and other related fields.  But with the rise of commercial satellite imagery, the slow demise of wet process aerial film cameras and the development of digital imagery analysis systems like ERDAS Imagine and ESRI’s improved raster management routines in ArcGIS there has been less and less call for hard copy stereo image analysis. Software routines now handle most analysis tasks.  Of course photogrammetrists still process, manage and analyze stereo imagery, but it’s all done on high end digital systems these days.  The fields that used to derive benefit from hard copy stereo imagery – topography, geology, forestry, hydrology, even the US military – all seem to have lost their institutional ‘feel’ for the usefulness of stereo imagery analysis.

The issue was brought home to me this week when I invited a small group of GIS professionals and Engineering staff (both licensed civil engineers and engineering technicians) to drop by my desk to have a look at these stereo photos.  Most could not get the photos properly aligned underneath the stereoscope. Few recognized any real benefit from seeing the structures in stereo.  Most thought it was just a cute parlor trick. That’s a shame because the stereo photos permitted quick and easy identification of features that are not readily apparent in the same 2D images.  Things like antenna masts and raised utility piping on the roofs of concourses, raised concrete pads and curbing in the aircraft gate areas and even small assemblies like receiver domes on the tops of aircraft fuselages stood out in clear detail when viewed in stereo.
.
So how does one use stereo photos for analysis?  Check out this blog posting from a while back.

Conducting stereo analysis using hard copy photos should be much cheaper and easier these days.  Years ago in the era of wet process film cameras making copies of stereo photos was time consuming and expensive. Someone had to pull a roll of film negatives, go into a darkroom and make prints one by one. With today’s digital imagery systems all one has to do is download the image files from a server and print them out using relatively cheap but very high quality color ink jet printers.  The images I received from our contractor were full resolution TIFF files, each about 1.4 gigabytes.  I was able to subset just the areas I wanted to view and print them out at full resolution using only the image management software that comes with Windows 8.  Fast and cheap!

Federal and state governments are sitting on a gold mine of historical stereo aerial photos.  The Federal government (USGS, USC&GS, Soil Conservation Service, Department of Agriculture, Tennessee Valley Authority, Army Corps of Engineers, etc.) started using stereo aerial photography for mapping as early as the mid-1920s and over the course of the next 90 years proceeded to photograph virtually all of the United States in stereo.  Stereo aerial photography was the foundation of all of our topographic mapping activities through most of the 20th century and it remains so today.  Much of this photography is still held in individual agency archives or has been turned over to the National Archives. I’d love to see the National Archives digitize and post nationally significant stereo pairs of images online for downloading and viewing. Places like the Grand Canyon, Yosemite and Yellowstone or historic events like the Mount St. Helens post-eruption photos or levee breaches along the Mississippi River during the spring floods.  Even historic shots of our cities and suburbs that will help students understand how topography impacts issues like urban sprawl.

Humans view and relate to their world in three dimensions.  It’s a shame that today we are relegated to investigating it via boring 2D computer displays.  I think it’s time to bring back 3D image analysis!

Garmin Gets Serious

I got a news release today that Garmin is about to release their first Android-based GPS receiver.  This is a move I long suspected one of the major GPS receiver manufacturers would make, and given Garmin’s market dominance and previous experience with Android I naturally assumed they would be first.

Garmin calls it the Monterra.  What is it?  Well, it’s essentially a smartphone without the phone.  An Android based GPS unit with a digital camera, LED flash, compass, barometer, gyro, accelerometer, Wi-Fi, Bluetooth, MicroSD card slot, etc.  About the same features you’d expect to find on a mid-high range smartphone.  Ho-hum.

But the Monterra offers some key differences.  First, it started life as a GPS receiver, designed by the world’s leader in consumer GPS technology.  This means the GPS performance and antenna design should have received priority consideration.  Next, it’s IPX7 compliant, which means it’s highly water resistant and shock resistant.  Third, it has user replaceable batteries.  Limited battery life is perhaps the single biggest argument against using a regular smartphone as a back-country GPS receiver.  With user replaceable batteries, and the use of standard AA cells, Garmin makes this a serious off-the-beaten path unit.  And last, it uses Android.  What, you ask?  Why is that important?  The adoption of Android as the OS opens the device to a whole range of outstanding GPS and mapping applications.  In fact, I’d go out on a limb and say that most users will load this thing up with third party apps and pay little attention to the included Garmin apps and map package offerings.

But my interest in the device focuses on its potential as a serious GIS data collection tool.  For the first time we have a rugged, water resistant Android-based GPS unit that should be able to run ESRI’s ArcGIS and Collector apps and Trimble’s new Terra-Flex app.  It offers all the hardware capability those apps need to leverage for effective data collection – good GPS performance, high resolution digital camera, a responsive high resolution touch screen and good battery life.  Once ESRI gets its act together and introduces data caching with their Android apps the lack of full-time data connectivity via a cellular data plan won’t be so important.  ESRI may well be there by the time this device is released (and Terra-Flex is already there).

I only have three concerns.  First, the relatively small 8 gigabyte system memory.  Second, Garmin has not announced what version of Android this will ship with.  Here’s hoping it’s at least 4.1.  And last, the price.  Garmin has initially priced this thing at $650.  When you consider an unlocked top end smartphone like the iPhone 5 or the Samsung Galaxy S4 goes for just a bit more, and the very capable Google Nexus 4 goes for way less, you begin to think this thing is somewhat over priced.  I’m hoping the retail pricing comes in a bit less.

Still, it has the potential to be a very price competitive and capable field data collection unit.  Is it about time to retire the old Juno?  We’ll see…

Trimble TerraFlex

Trimble released their cloud based data collection solution called TerraFlex yesterday and I spent much of the day playing with it on both the iPhone and the Juno 3D.

Some observers (including me) thought TerraFlex would be a shot aimed at ESRI’s ArcGIS Online product. It is clear, however, that TerraFlex is a very different animal.  Whereas ArcGIS Online is a map-centric platform against which you collect data, TerraFlex is a forms-based data collection platform that uses simple maps only as a background.  TerraFlex is better described as ‘TerraSync lite’ and the focus is on simplified data collection tasks using a variety of handheld devices like iOS and Android smartphones and Windows Mobile devices like Trimble’s own Juno-series data collectors.

All projects start with forms, and TerraFlex provides an easy to use web interface for creating the data collection form.

The TerraFlex form creation page.  It is surprisingly simple to use.

Once you create a form you upload it to the TerraFlex ‘cloud’ (hosted on Amazon’s EC2 cloud servers) as part of a data collection project.

A data collection project consists of one or more data collection forms

Once you have the project uploaded to the TerraFlex cloud you can log into TerraFlex from your mobile device, download the project and its assigned data collection forms and start collecting data.

TerraFlex uses Google Maps/Earth as the map interface.
It’s your ONLY map option!
The forms interface on the data collector is
very easy to use.   The use of drop down selections
greatly simplifies the collection tasks

You can set your options on your data collector to sync the new data immediately over any available network connection (cellular data or wi-fi) or set it so sync only when the device is back under wi-fi coverage (this will reduce data plan usage on devices like the iPhone).

Once your data is synced with the TerraFlex cloud you can go back in to the desktop web interface and view the data, do basic edits and export it for use in other packages like ArcGIS or AutoCAD.

The TerraFlex desktop data management interface

Overall I was impressed with the ease of use of all components of the TerraFlex system – from the forms creation on the desktop to the data collection on my iPhone to the data management back in the desktop interface.  Part of the ease of use stems from the fact that there’s not a lot there!  Remember, this is not a complex web mapping package like ArcGIS Online.  TerraFlex is a simplified data collection tool and at that task it excels.

Trimble also got smart with the pricing.  TerraFlex is licensed by the individual user vs. a software license tied to a particular piece of hardware as with TerraSync.  A TerraFlex license cost is $250 per user per year.  The subscription is tied to the individual and Trimble doesn’t care what device(s) you use or how much data you collect.  Two hundred and fifty bucks may seem like a lot, but if you’ve ever priced other GIS data collection software like TerraSync (over $1,000/license) or ESRI’s ArcPad (about the same) or even an ESRI ArcGIS Online subscription (which starts at $2,000 and has much higher management overhead) suddenly the cost of a TerraFlex license looks downright reasonable.

Of course at this price the list of what you don’t get is pretty long.  There’s no data position correction capability either through the use of a virtual reference station or via post-processing.  The data import and export options are also very weak.  This area in particular needs a lot of work.  Your export options are either KML, .csv (spreadsheet) or the ESRI ArcGIS XML format.  The .csv format has some issues because the software concatenates the lat/long data into a single spreadsheet cell, making it tedious to parse the latitude and longitude data into separate columns for easy import into GIS and CAD.

But this is a first generation product and I’m sure things will improve.  Trimble provides support via their TerraFlex forums and their technical people were jumping right in yesterday and answering customer questions.  I’m sure they are compiling a list of future improvements, and the great thing about cloud-based services is that you don’t have to wait around for a service pack release.  Things get updated in the background and are immediately available across the entire user base.

Overall I like what Trimble has done here. We’ll keep an eye on this product as it moves forward!

Where’s The Line?

First Michigan picks on Ohio, now it’s picking on Indiana:

Border Line Project Gets Funds

But any time you can have fun with a lawyer it’s a good day:

Owens remembers a telephone call he got from an attorney representing the victim of a traffic accident along the state border.
“He asked me what state the accident was in,” Owens said.  “I said, ‘I can’t really tell you. We don’t really know where the state line is.’”

Yessir, a very good day!

Trimble Juno 5

I got a chance to spend a few days playing with one of the new Trimble Juno 5 handheld data collectors and thought I’d give some initial impressions.

I’ve been discussing the Juno 3 series handhelds a lot lately on this blog.  They are great devices that offer a lot of functionality at a reasonable price point.  I think Trimble would agree.  My sources tell me the Junos 3 series have become one of Trimble’s most popular selling data collectors.  But as good as they are, the Juno 3’s still have some limitations.  First is processor speed.  The Juno 3 uses a relatively low capacity 800 mhz Samsung processor and there’s a lot of overhead involved in just running the operating system, Windows Mobile 6.5.  It shows.  The Juno moves like a turtle on a cold morning when executing some processor or graphics intensive processes.  Still, they have proven to be stable & reliable devices and we rarely have crashes or lock-ups.  Things may run slow, but they run.
The next drawback is the screen.  It has a measly 3.5″ QVGA screen that offers only 340 x 320 pixel resolution.  It’s ‘touch sensitive’ only in the sense that if you imagine your finger as a stylus and stab the screen pretty hard with it (and in the right place) the screen will react.  Virtually all functions require the use of a hard stylus.  There are two good points about the screen, though.  First is that it’s readable in sunlight.  Second is that the low resolution graphics put as little demand as possible on the already slow processor chip sets.  From that perspective I guess the screen functionality is acceptable.
Last year Trimble announced the new Juno 5 series of data collectors.  While the Juno 5 doesn’t replace the Juno 3, it offers a new ‘smart phone’ form factor.  When I first read about the new Juno I dismissed it as a gimmick, a repackaged Juno 3 designed to appeal to the GenX crowd that can’t work with anything that doesn’t look like an iPhone.  But a few weeks ago at the ESRI Southeast Users Conference I got the chance to handle one and was initially impressed.  First, this thing is BIG, and it’s HEAVY.  Think a Samsung Galaxy S4 on steroids (though it’s not made by Samsung).  This Juno is heavy as in solid & rugged.  It impresses as a serious piece of hardware.  Next, the screen.  Lots of screen real estate and sharp as a tack with great resolution and contrast.  As good as most current smartphones.  I was impressed and I left the conference determined to get my hands on one to test.
As luck would have it my friends at NEI were more than happy to oblige.  They loaned me a Juno 5D for a few days as part of a larger hardware test and I got to spend a few hours getting to better know this new beastie.
The hardware specs are available on Trimble’s website so I won’t regurgitate them all here, but we see improvements over the Juno 3D in two key areas – the CPU, which was switched to a 1 Ghz Texas Instruments processor, and the screen which is a WVGA TFT panel offering 480 x 800 pixel resolution.  I have to assume there’s an upgraded graphics processor too.
For those who have experience running either the original Juno S series or the Juno 3 series devices, the improved performance of the Juno 5 is an attention getter.  Finally, a device fast enough to make Windows Mobile so responsive you’d almost think it doesn’t suck.  The screen responds to finger gestures just like you’d expect a smart phone’s screen to respond.  No stylus needed.  Heck, the Juno 5 doesn’t eve come with a stylus!
The two Junos side-by-side.  The screen on the 5D
is not just larger, but the quality and resolution is
exponentially better.

Trimble also put a lot of thought into the case design.  The Juno 3 series devices are well built and water resistant, but the case integrity is highly dependent on a number of rubber plugs that cover all the little ports the thing has – power, USB & patch antenna.  The 5D cleverly reduces the number of ports needing covers by combining the USB and power connector and designing the connector as an uncovered but permanently sealed series of small contact pads.  The layout looks similar to the old serial port connection.  The charger/synch cable has a connector end with a number of small spring loaded contact pins that mate with the contact pads on the device, and the whole thing is secured by two tried and true thumb screws.  I first ran into a similar arrangement with my DeLorme PN-60 GPS.  It’s a design that eliminates the possibility of water intrusion and ensures the connection stays tight even under rough conditions like being bounced around in a car.  It works great.

The USB/power connector (on the left).  This ‘port’ is unprotected simply
because it’s weather sealed and doesn’t need any protection.

The Juno 5D is a smartphone with a big screen and it runs a number of power hungry applications (like Trimble’s TerraSync or ESRI’s ArcPad).  It needs a big battery, and the battery accounts for much of this unit’s weight.  The battery cover is screwed to the back of the case with 12 miniature Torx head screws, and I’m guessing the manner in which it’s attached plays a large part in the Juno’s overall ruggedness and water resistance.  Reports are that the 5D has a shorter usable battery life than the 3D.  I believe it.  It’s just the nature of the technology.  The 5D is just a more power hungry device.  Based on my limited testing I think you can expect to get at least 4 continuous hours of field data collection out of one of these handhelds before having to go for a recharge.  By the way, Trimble reports that the battery is replaceable, but it must be done by an authorized Trimble repair center.

Rear of the 5D case showing the battery cover
and 8 mp camera with flash

Trimble also gave the 5D an 8 megapixel digital camera with flash.  Compared to the somewhat muddy, low contrast pictures the Juno 3D’s 5 megapixel camera delivers this one is pretty good.  Not iPhone good, but still not bad.

So how did it perform in the field?  I ran some simple point feature collection jobs around my office building using ArcPad.  Uncorrected accuracy was as expected – about 5 ft. for those points under open sky.  Running ArcPad on the larger, brighter screen was pretty interesting.  The high screen resolution renders the normally fuzzy low-res ArcPad icons in sharp detail, but they were pretty small as presented on the display.  It took a bit of practice to figure out just where to tap to get them to react.  But once I got that figured out I was off and running.  The 1000 mhz processor allows ArcPad to run pretty snappy, and there was no system lag when choosing to collect a point or move to a different screen. The digital camera is still slow to launch when collecting a photo point, but not anywhere near as slow as on the 3D (which is glacially slow).  Since ArcPad passes the photo collection process over to the Windows Mobile slow, clunky camera interface I don’t think we can expect much more of a performance improvement here.

Based on my limited testing I really like this new unit.  It’s a clear step up from the Juno 3 series in performance and features.  But it’s not perfect…

First, price.  This thing retails for a whopping $1,800.  That is about $700 more that the Juno 3D.  Ouch.  Is the improved form factor, screen size and resolution and faster processor worth an additional $700?  I’m not really sure considering that the Juno 3D is still a very capable device and can do everything the 5D can do, albeit just a bit slower.  Keep this price factor in mind as we move forward in the discussion.

Let’s next consider GLONASS, or the lack of it.  Really Trimble?  Really?  Trimble seems to want to position their GLONASS-capable devices towards the premium end of their hardware line.  That may have been an OK marketing move a few years ago, but today just about every smartphone and new consumer GPS coming onto the market is GLONASS capable.  Heck, Garmin’s bottom-barrel low price leader, the eTrex 10 (currently selling for $103 on Amazon), has been GLONASS capable for over a year now!  The days of GLONASS receivers being a ‘premium’ product are long over.  Wake up Trimble.  At this price point I think it’s perfectly reasonable to expect the 5D be GLONASS capable.

Next, software.  You pay $1,800 for a very capable piece of GPS hardware but it comes with no native navigation package and the ability to add apps is very limited.  No mapping or navigation software, nothing to casually collect waypoints or GPS tracks with.  Now, I realize this is a ‘professional data collector’, but it would be nice if Trimble ported one of their consumer-grade iPhone or Android apps over to the Windows Mobile OS and included it free on the device.  TerraSync and ArcPad are great data collection tools, but lousy street navigation tools.  As a geospatial project manager I expect a device with this capability to offer more software features.  There simply is no reason why I shouldn’t be able to use it for things like work party navigation and jobsite familiarization, job check-in/check-out, have an eReader for portable document management, etc.

Last, I experienced a few lock-ups on the device while running ArcPad 10, mainly when trying to collect photos.  All of these lock-ups required a system reset, and all collected data was lost.  It seems to me that a firmware or OS upgrade may be in order.  I’d be hesitant to put this device into the hands of work crews until this issue is corrected.

So, is the Juno 5D worth the investment?  Certainly you can get all the functionality of the 5D in the much less expensive 3D.  However, the new smartphone-like form factor of the 5D is very compelling, and the performance improvements it brings to the Juno line mean something in the real world of field data collection: a better form factor, better screen, faster overall performance.  But the shortcomings are glaring and could have been easily addressed by Trimble before they released this device to market.

At the $1,800 price point I think the 5D is worth the investment only if your organization needs the improved performance this Juno provides.

But let’s look into the future.  I think the 5D shows us where Trimble intends to take this very successful line of handheld data collectors.   We will never see a new Juno that looks like the 3D.  The smartphone ‘experience’ is where the field is headed.  From that perspective the Juno 5D is a good first effort.  It’s going to be very interesting to see what future versions bring.

Around The World On A Cup Of Coffee

My Grandmother was never one to let a good product promotion pass her by.  I think it was part of her fascination with her adopted country.  Where else but in America could you save up a few box tops or clip a few coupons, mail them off and the sponsoring company would send you something free in the mail.  Often these little give-aways would be handed down to one of her grandchildren.  It was always fun to visit Grandma – you never knew what she had waiting for you.  Usually it was just some small trinket from a cereal or soap company.  Occasionally it was something really neat.  One year she gave me and my brother miniature Civil War cannons she got from the Quaker Oats people – you know, the ones that shoot puffed rice out of a cannon.  Those cannons ended up shooting thousands of pretend cannon balls in hundreds of pretend battles we held on our living room floor.  Oh, the pretend carnage!  Even after I was all grown up and in the Army I’d still occasionally get an odd item or two from her.  Bless her heart, she never stopped thinking about us even long after we had left home and struck out on our own.

In the late 70’s the Nestle company was running an advertising campaign highlighting the fact that their instant coffee, Nescafe, was the #1 selling coffee product world wide.  It was no idle boast.  Nescafe was (and still is) extremely popular in Europe, and Nescafe is commonly listed as a separate drink option on many restaurant menus.  A lot of Europeans prefer it over brewed coffee.  While I’m no fan of instant coffee I do have to admit that Nescafe is the least objectionable of the bunch.

As part of the promotion Nestle produced a series of small glass coffee mugs emblazoned with a world map.  Nothing fancy, just a highly simplified small scale map with a grid.  My Grandmother got a set and passed them on to my parents.  One day while home on leave my Mom passed along a couple of these mugs to me. At the time I was working as a topographer for the Army and maps were my business, so I thought it was a neat coincidence.  I kept one of the cups on my desk at work and even occasionally drank coffee out of it.  Over time the world map wore off and in a few years I was left with just a bare glass coffee mug so I pitched it.  Some where along the way I lost its twin.  It probably got chipped or broken during one of our many moves while I was in the Army.

Being a lover of all things topographic, even kitschy little glass coffee mugs with world map appliques, I always kept my eye open for replacements.  Last week I was cruising around eBay and decided to do a quick search for ‘nestle coffee cup’.  I was surprised at the number of listings that came up for my long lost little mug.  Apparently Nestle had millions of them made and most are still available through eBay sellers.  I found a dealer who gave me a good price on a set of them and a few days later I was the proud owner of four gen-u-ine 1970s vintage cheap cast glass coffee mugs sporting world maps.

I love ’em!

So let’s take a quick world tour courtesy of Nestle…

Eastern Hemisphere.  Hey, where’s the British Isles?
Interestingly, they included Lake Baikal.
Western Hemisphere.  Florida’s been squinched into a vestigial bump
but at least they included Puerto Rico.

Being a topographic geek I note that the far north and far south polar regions are cut off and the grid appears to be square, so I’m guessing it’s a Universal Transverse Mercator projection.

Hands Off Data Collecting With Huey, Dewey and Louie

A few weeks ago I posted a blog discussing how my organization is testing the newest release of ArcGIS for Windows Mobile 10.1.1.  I’ve started to use the combination of the ArcGIS mobile software and my Trimble Juno to collect walking trail data on a fairly regular basis.  I call it ‘development’.  My wife calls it ‘playing around.’

Anyway there are three occupants of my house that think my only job in life is to take them outside and entertain them.  They shall rename nameless, but they each have four legs and a tail.  Whenever they see me putting on a jacket or lacing up my boots or tossing things into a backpack they go nuts jumping around, barking and causing general mayhem.  “It’s walkie time!”

Now, I don’t mind having them along on a walk or hike.  They are generally well behaved.  Unless they see a cat.  Or a deer, squirrel, rabbit, duck, goose, bird, grasshopper, snail, ant or, heaven forbid, another dog.  Other than that they’re fine.  Great company.

But managing three dogs and a data collector is all but impossible unless you’re an octopus.  I was in a quandary; how do I take these three amigos along on a data collection hike and get everything done?  Well today I had one of those ‘duh’ moments, as in ‘duh, why didn’t I think of this before?’  Just launch the collection job on the Juno, toss it into the zippered compartment in the lid of the rucksack (where it sits up high and the internal GPS receiver should have a fairly good ‘view’ of the sky), hitch up the dogs and start walking!

Launch the data collection job on the Juno and go!

When I started today’s walk I wasn’t 100% sure how this would work out.  I’ve carried other GPS receivers in pockets on the shoulder straps of rucksacks before, but I wasn’t collecting data with those units.  As I walked the trail my mind was working, thinking up all sorts of configurations and contraptions I might use to improve signal reception.  By the end of the walk I had myself convinced that what I needed was some sort of pole mounted external antenna.  I had it all figured out in my mind – about 4′ of quarter inch PVC with a metal plate epoxied to one end and a magnetic patch antenna (which Trimble makes for the Juno) stuck to that, with the antenna cord running down the tubing and connecting to the Juno inside my rucksack.  I could lash the PVC tubing to the side of the pack using the compression straps.  Absolutely, perfectly Rube Goldberg-esque!  Why it was so clever I’d be the envy of all the neighborhood GPS data collecting kids!

Rides nice and high in the pack where signal reception is pretty good!

At the end of the hike I pulled the Juno out of the bag and realized I didn’t need all the fancy gadettry I was dreaming up.  The Juno did just fine collecting data while sitting snugly inside the rucksack lid.  It’s not a perfect setup by any means; the GPS signal still has to penetrate the bag material and my big fat noggin’ blocks a lot of the signals, and it’s impossible to stop collecting streaming GPS data to collect point data.  But for hikes like these where I’m just after trail alignments it works fine.  The Juno isn’t a survey-grade instrument anyway so some GPS track shift is to be expected, particularly under heavy tree canopy.

“Hey, we really like this data collection thing!”

So how did we do?  Not bad.  I need to clean the data up somewhat and I know that in the future if I’m set up for GPS data post processing I’ll get better accuracies, but for now it’ll work.  As was said in that classic movie about chronic over-achievement, “That’ll do pig.”


My Data Is More Accurate Because It Got Here First

Earlier this month Eric Gagstatter wrote a great little article for Geospatial Solutions Monthly titled “Nightmare on GIS Street: Accuracy, Datums, and Geospatial Data”.  Anybody who’s worked in the GIS field for more than a week has experienced the kind of issues Eric discusses.  Simply put, it is a rare event when data pulled from multiple sources fits together with any semblance of accuracy or precision.

For a small scale project (let’s say 1:20,000 or smaller) data fit is less important – at those smaller scales ‘eyeball close’ is often good enough.  The problem we face is that with modern GIS software the user is not stuck with a fixed scale like they were when everything was based on paper maps.  We live in the era of Google Earth, the era of high resolution satellite imagery, where everybody expects to be able to read the address number on their mailbox from space.  This new found ability to zoom to any scale with just the scroll of a mouse wheel has highlighted a problem that the general public and, to be frank, many Geospatial and civil engineering professionals, were not aware of: the data doesn’t fit.

Eric highlights the most important factor impacting this issue – the emergence of high precision GPS-based field data.  In the past 10 years or so GPS data, that data collected by survey grade or SBAS* augmented GPS units, has dramatically exposed the errors embedded in decades of historical geospatial data.

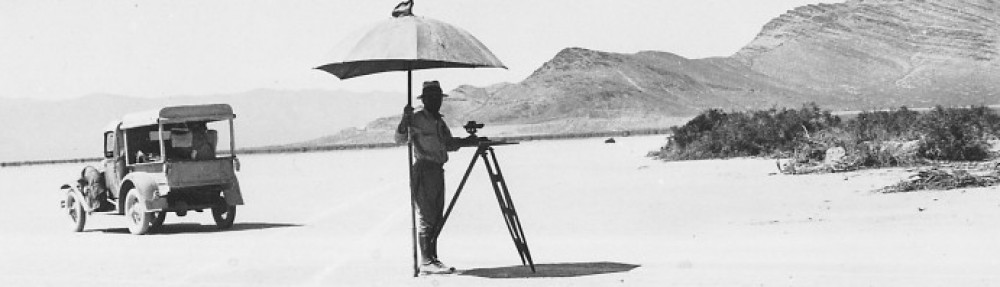
It’s not that this old data was collected badly – most of it was collected to established standards using the best resources and techniques available at the time.  In the old days it was paper maps, scaled aerial photos, compass headings, pace counts (or odometer readings for really long distances) and field notebooks.  Mapping grade accuracy was the accepted norm.  When you were using 1:24,000 USGS topo sheets as your project base an error of +/- 24 meters (the approximate National Map Accuracy Standard for those map sheets) was good enough.  Formal surveys were expensive and time consuming, and only done if there was a strong business justification – usually to establish legal boundary definitions, accurately map out small project areas, or precisely position critical features.

Today a Geospatial professional can collect data with handheld GPS units that easily achieves accuracies of +/- 15 feet with just SBAS augmentation, and centimeter level accuracies with survey-grade RTK (real time kinematic) equipment.  Accuracy has improved by several orders of magnitude and the cost of acquiring that data had dropped dramatically.

While Eric focuses on the issues of datums and datum transformations, my experience is a little different.  I work at a major airport that has terabytes of historical CAD data and a warehouse full of historical project plans on paper, mylar or linen that go back to the early 1940s.  Virtually all of this data is referenced to a local grid system that was first established as a construction grid back in 1948.  At the time this grid was established it was never formally defined in reference to the local State Plane coordinate system.  In fact, the surveyors who laid it out committed the cardinal sin of not establishing a central meridian that is oriented to true north.  The entire grid is rotated a few degrees off of true north and that angle of rotation was never defined when the grid was established.  For years this was not a problem.  The airport was happy to exist as an ‘island’, floating on the face of the earth within its own little grid system.  However, when the airport started to expand dramatically in the 1960s the engineers realized they needed to start tying into properly defined coordinate systems like State Plane.  USGS and USC&GS survey control was extended onto the airport and several monuments were defined in both the local grid system and State Plane.  This allowed project engineers and surveyors to ‘extend’ State Plane control onto their project sites if required, but all design and construction work was continued in the local grid system.  To this point all design work was done using old manual drafting methods, so the levels of error inherent in these processes were acceptable for the time.

In the 1980s CAD (computer aided design and drafting) systems started to be used on more and more projects at the airport. Since our local grid is a simple x,y grid based on distances in feet measured from an origin point it was easy to lay out in CAD.  No need to worry about that pesky rotation.  Or, for that matter, grid-to-ground mismatches over long distances (like say on a 9,000′ runway).  But very soon some serious folks with serious money, like the Federal government, began asking for airport data in a ‘real’ coordinate system like State Plane.  A number of attempts were made to try to define the local grid as a true spatial coordinate system (with a tie to a known coordinate system, an origin point and a rotation and scale factor) but with no success.  As a result some very sloppy work-arounds were developed, most using a ‘local fit’ method  – an engineer or CAD technician would snap local project data from one coordinate system to known good data in the other coordinate system; building corners, grid tics, manholes, whatever they could find.  The problem was that a lot of ‘known good’ data turned out to be not so good.  Errors propagated and started to become uncontrollable.  The engineering staff worked around this by referencing in local project data (for example, a new taxiway segment) against a small subset of the overall CAD basemap for the airport.  This method tended to keep the the coordinate system shift error within acceptable limits for the small project area, but when the data was added to the larger CAD basemap grid shift errors of up to 15′ were common.

When my Geospatial group came on board in 2007 the coordinate system transformation issue quickly became one of our biggest headaches.  We were faced with creating an enterprise geospatial database from scratch using this legacy CAD data.  We desperately needed a proper spatial definition for this local grid system, something that would work in both our CAD and GIS systems.  Our engineering staff was happy to dump the issue in our lap.  In fact, when I interviewed for the job one of the senior engineers told me that if I was hired the first thing he wanted me to do was to “fix this damned State Plane thing.”

As we started talking with the engineering staff about the problem it became apparent they all had an institutional distrust of State Plane, or any spatial coordinate system for that matter.  They placed the entire blame for the data fit issues on ‘inaccuracies’ in the State Plane system – inaccuracies they couldn’t articulate.  In their minds all data prepared in their local grid system was golden.  After all, the local grid system was known.  It was proven.  It was simple.  They had built an entire world-class airport on it.  This goofy State Plane thing just got everybody confused and besides, when they did move their CAD data to State Plane it ‘got shifted all around’ and didn’t work anymore.  It might fit OK at one corner of the airport, but didn’t fit too well at the other.

We eventually got the grid transformation issue solved.  We attacked it from several directions and ended up with a very accurate local grid system projection file for use in both AutoCAD and ArcGIS, and a best-fit definition for use in Blue Marble (for bulk coordinate point conversions).  All of these definitions are based on the same survey data so errors are consistent and controllable from system to system.  We can hold transformation errors to about 0.2′ across the airport property.  And yet our engineering staff still retained a latent distrust of State Plane-based data.  The old institutional bias remained.  The perception that ran deep is that the old ‘known’ CAD data in the local coordinate system is somehow better, more accurate, than any newly collected GIS data.  There is a natural distrust of geospatial data; few civil engineers understand what geospatial data is, how it differs from CAD data and how geospatial data can be incorporated into planning and design projects.  If the data file doesn’t have a .dwg at the end of it they don’t like it.

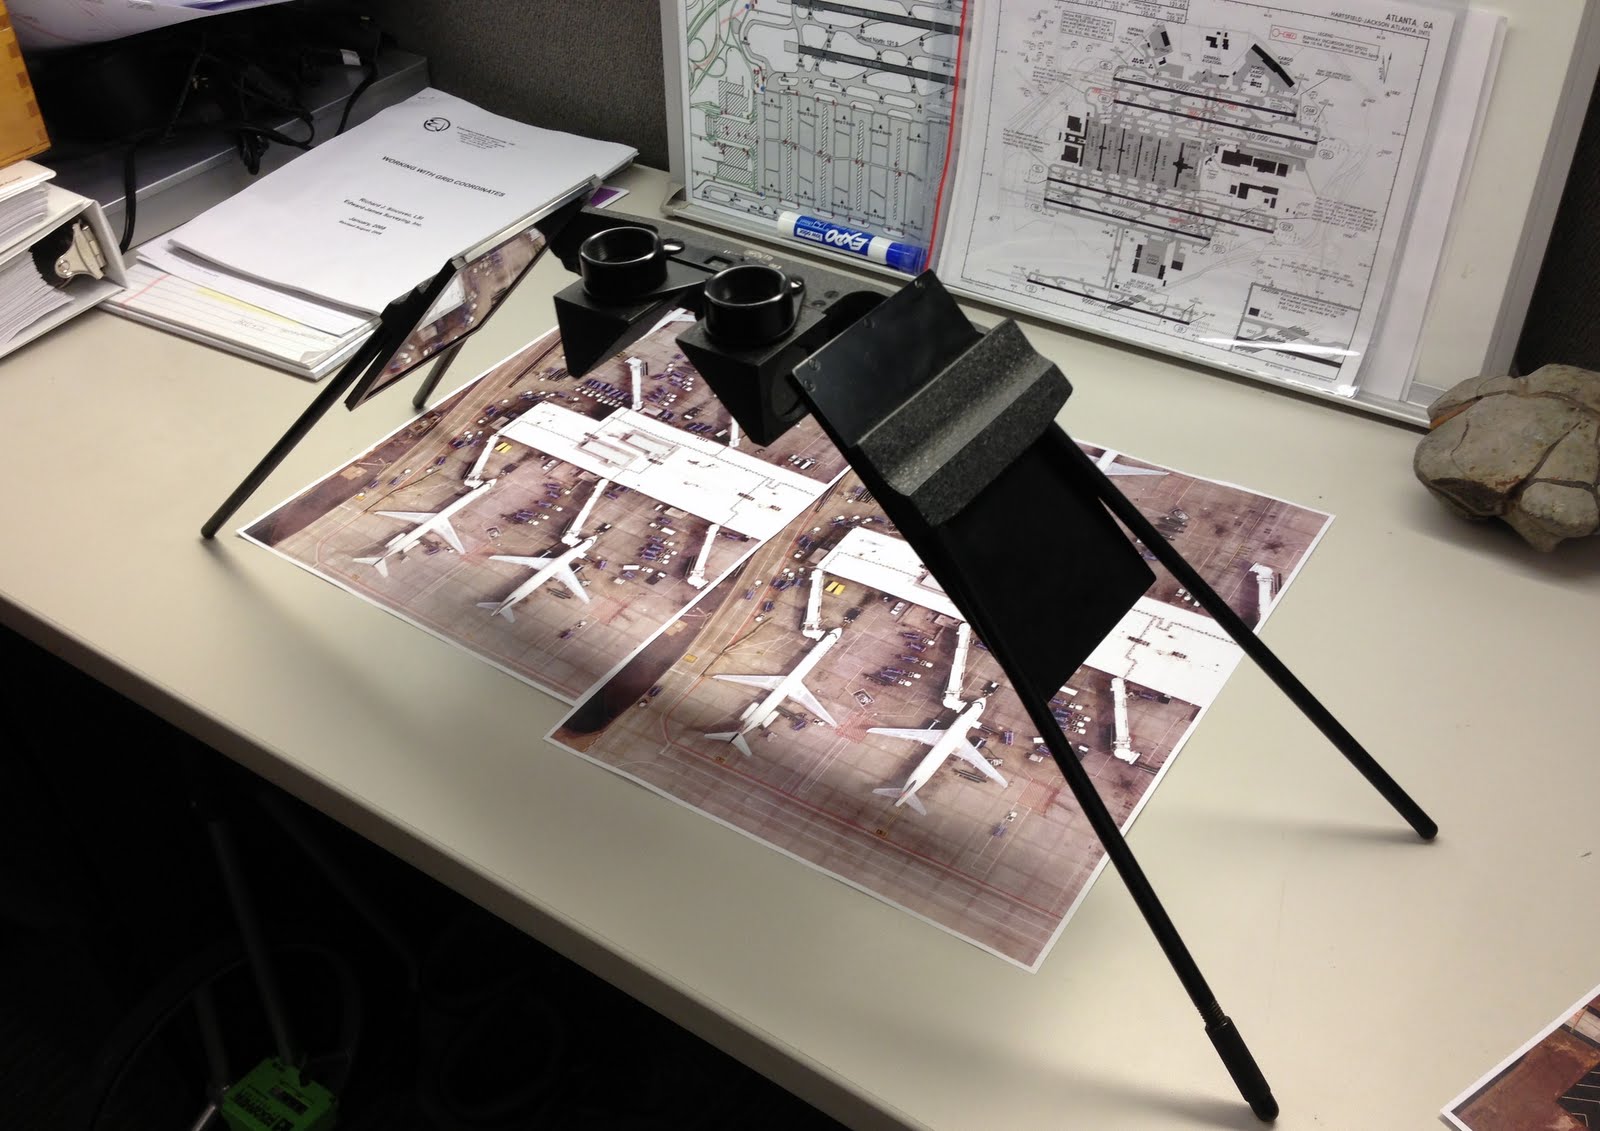
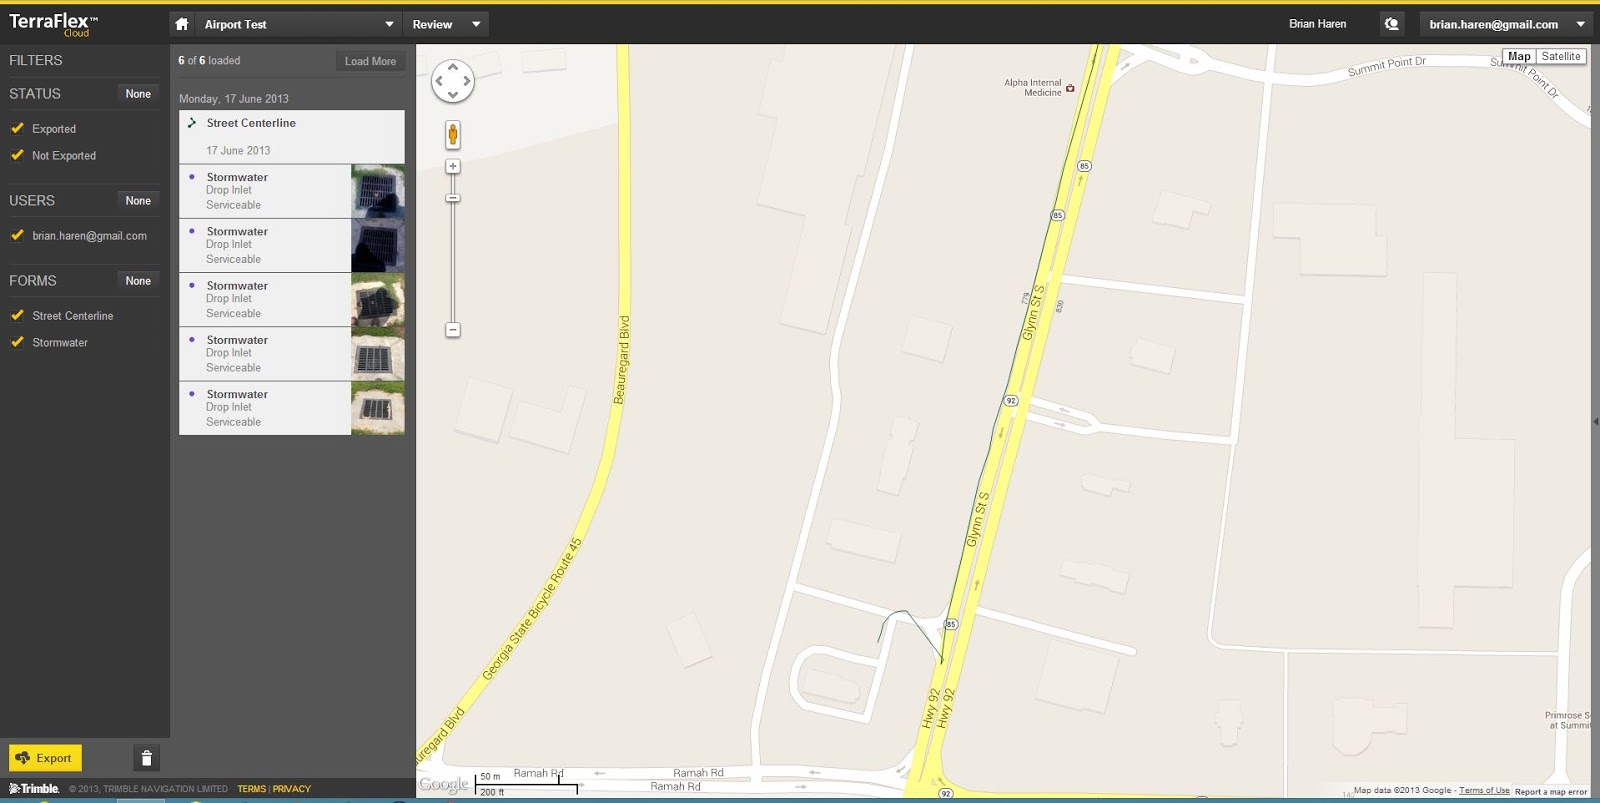
We decided to approach the perception issue from two directions.  The first was a current high resolution, high accuracy orthophoto of the airport.  Using our newly developed projection file we were able to reproject the aerial from State Plane to the local grid system for use in AutoCAD.  For the first time ever the engineers and CAD staff had a single continuous coverage aerial image in their grid system that could be used as a base for project planning and drawing development.  Next, we acquired RTK-based data collectors that are capable of centimeter level accuracy.  We launched on an aggressive project to collect photo identifiable data – manholes, paint markings, slab joints, airfield lights – and provide the data in both grid systems as a tool to check current and historical data against.  From this we created a ‘trusted’ CAD file,  one the engineering group verified using their own sources.  Ever so slowly some of the doubters started to come around.  Once they started matching their legacy data against these new sources and saw the problems for themselves they began to do more aggressive data checks and not take CAD data, old or new, at face value.

Yet we continued to have perception problems.  The old-line engineering staff retained a deeply embedded distrust of GIS data in State Plane and our insistence that all legacy data to be closely checked and adjusted if necessary.  Their reasoning actually sounded pretty good – “We spent decades building a world class airport with this CAD data and it all came together.  How can the data be wrong?”

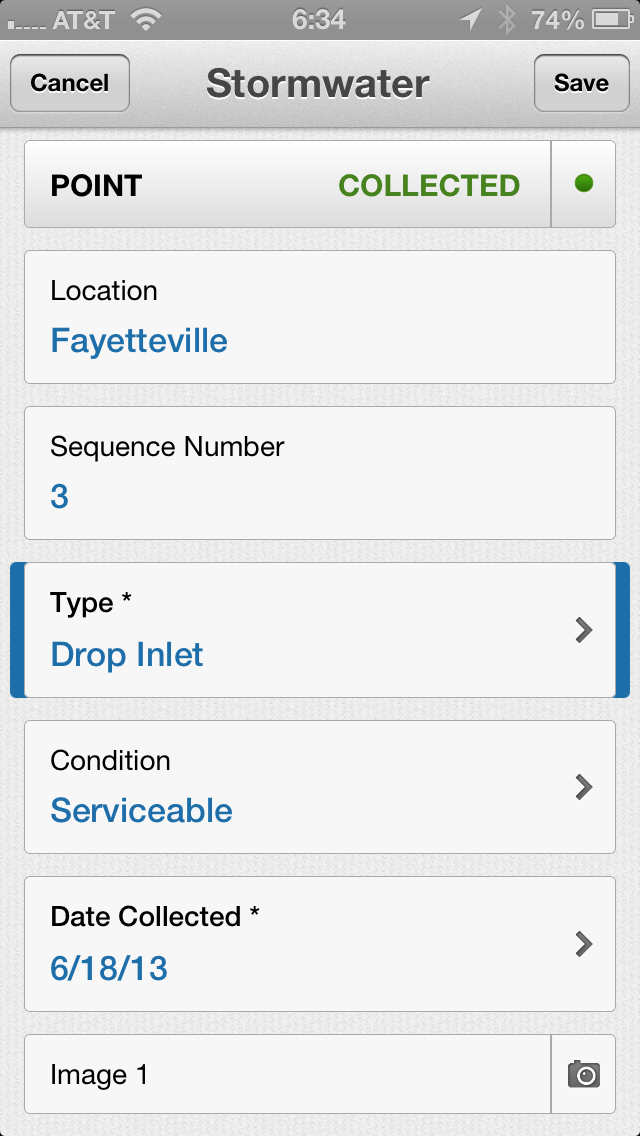
Our GIS group didn’t really have a good response until some of the long time CAD staff complained that “it’s impossible to get as-builts around here.”  Our antennae went up and we started to do some digging on the issue.  Very quickly the problem revealed itself.  Our engineering staff rarely received true as-builts from the contractors that do construction on the airport.  The as-built delivery requirement is written into most contracts but is rarely enforced.  Contractors would regularly walk away from the as-built requirement and eat the contract penalty because they were too busy on other airport projects or the cost of developing the as-builts exceeded the monetary penalty.  If a contractor did deliver what they labeled as ‘as-built’ drawings they were seldom, if ever, checked for accuracy and completeness by the project manager.  The data was accepted at face value and often recycled for use on the next project.  Errors in spatial accuracy or attributes (pipe sizes, slab thicknesses, etc.) were unknowingly propagated from project to project as the project planners and designers used the same inaccurate data over and over again.  Down the line some errors became so glaringly obvious (like a stormwater line flowing uphill) that the engineering staff would hire engineering firms to go to the field and conduct existing condition surveys.  It was not unusual for the airport to hire the same firm that originally delivered the bad data to go back out and field verify what they should have originally delivered years before in the project as-builts!

But this only addresses half of the question.  The fact remains that this airport got built, and got built pretty darned well.  Was it all built on sloppy CAD data and it’s just a happy accident that everything fits?  Well, once we understood the as-built issue the rest of the story fell into place.  The engineering staff at this airport only does planning and initial design.  The final design work and construction drawings are done by contracted engineering firms.  Construction drawings are based on a number of sources – initial design, existing condition surveys and final design plans.  Construction drawings are what the project engineers and tradesmen take to the field to actually build against  These are the drawings that get marked up as modifications are done in the field and it’s these drawings that should be used to generate the as-builts.  These engineering firms do a very good job of making sure everything fits within the designated project space, and any ties to existing systems – utility lines, roadways, buildings, etc. – are adjusted for in the final design or in the field.  But we are back to the old as-built issue.  Much of what was actually constructed in the field never makes it back into the airport’s master CAD drawing.

So the reality is that the airport got built, but the airport doesn’t have a complete and accurate record of what got built.

But I do get the sense that we are over the hump.  In the last two years we’ve noticed an improvement in the consistency of the spatial accuracy of the CAD data being delivered.  We still find a good number of attribute data issues (stormwater manholes labeled as sewer manholes, that sort of thing), but as far as spatial accuracy things seem to be greatly improved.  I put it down to our engineering staff’s increased use of known good data as a quality control check, increased emphasis on as-built delivery, a willingness to let us be part of the quality control check process, increased dialog between the CAD and GIS analysts and an increased dependence on our RTK data collectors to do quick field verification.  In fact, our engineering staff is now the #1 hands-on  user of our RTK systems.  The GIS group also has tight relationships with many of the major construction contractors doing work at the airport and we provide the coordinate system definition files and verified base data for use in project planning.  We also offer ourselves up as the data conversion experts and will help contractors verify that their data has been properly moved from one grid system to the other.  Over time our insistence on spatial accuracy has ‘leaked into’ the engineering business processes and workflows here at the airport.

We’ve shifted the paradigm just a bit and the momentum is in our favor.  Geospatial engineering 1, bad data 0.  That’s the way it should be.

Brian

*SBAS = Space Based Augmentation System.  There are several SBAS systems in use around the world.  These are satellites in geosynchronous orbit that transmit correction data for the US GPS satellite constellation.  The Wide Area Augmentation System (WAAS) is a set of satellites transmitting correction data over the US and the eastern Pacific and is maintained by the FAA and DOT.  If your GPS unit can receive and use these signals they will roughly double the accuracy of the position fix your unit provides.  You can read more about WAAS and SBAS on Wikipedia.