Patton’s Prayer

It’s become a Christmas tradition here on the Old Topographer blog to republish one of my most popular postings – the true story of General George S. Patton’s Christmas Prayer. So it is with Christmas 2016. I want to wish everyone a Merry Christmas and hope this holiday season finds you and your loved ones safe and happy. And please let’s keep all the service men and women, both deployed on battlefields across the Middle East  and stationed here at home, in our thoughts and prayers.


Patton2

In early December 1944 General George S. Patton’s 3rd Army was stalled in its advance to the Siegfried Line along the French – German border. Patton was a master of combined arms operations and he knew he needed tactical air support from the Army Air Forces before he could breach the Siegfried Line and push on towards the Rhine River.

But the weather was not cooperating. The winter of 1944 was one of the worst on record for central Europe. Thick cloud decks and heavy fog were keeping Allied aircraft grounded all across France and the Low Countries. Patton was frustrated, impatient and angry.  He saw German resistance crumbling before him yet he knew he couldn’t push forward into the German homeland without adequate air cover. The 3rd Army and its supporting 19th Tactical Air Command ground attack squadrons were a deadly team. Ground-based artillery often had trouble keeping up with the 3rd Army’s advanced forces, but the Air Force’s growing fleet of attack aircraft like the rugged and deadly P-47 Thurderbolt could range ahead of the forward ground forces, striking military strong points, attacking enemy convoys and in general wreaking havoc and helping to open lines of advance for Patton’s armored formations.

In the second week of December Patton’s frustration hit a boiling point. Patton was a man of deep religious faith and he absolutely believed that God was on the side of the Allies. The General decided it was time to remind the Good Lord just who’s side he was supporting. On December 8th Patton put out an order directing all 3rd Army chaplains to pray for good weather. At the same time he called for his staff chaplain, Colonel James O’Neill.

I quote from Patton’s published diary of WWII, ‘War As I Knew It‘:

General Patton: “Chaplain, I want you to publish a prayer for good weather.  I’m tired of these soldiers having to fight mud and floods as well as the Germans. See if we can’t get God to work on our side.”

Chaplain O’Neill:  “Sir, it’s going to take a pretty thick rug for that kind of praying.”

General Patton:  “I don’t care if it takes the flying carpet, I want the praying done.”

Chaplain O’Neill:  “Yes, sir. May I say, General, that it usually isn’t a customary thing among men of my profession to pray for clear weather to kill fellow men.”

General Patton:  “Chaplain, are you teaching me theology or are you the Chaplain of the Third Army? I want a prayer.”

Chaplain O’Neill:  “Yes, sir.”

What Chaplain O’Neill came up with is one of the classic military prayers:

“Almighty and most merciful Father, we humbly beseech Thee, of Thy great goodness, to restrain these immoderate rains with which we have had to contend. Grant us fair weather for Battle. Graciously hearken to us as soldiers who call upon Thee that, armed with thy power, we may advance from victory to victory, and crush the oppression and wickedness of our enemies, and establish Thy justice among men and nations. Amen.”

After the war the chaplain, Monsignor James O’Neill (by that time a retired Brigadier General) wrote down his version of the story. It helps clarify some of the dates surrounding the event. In the classic movie ‘Patton’ starring George C. Scott we are led to believe that Patton ordered the prayer in reaction to the 3rd Army’s difficulty reaching the Ardennes as it advanced to relieve American forces trapped during the Battle of the Bulge. The truth is that Patton ordered this prayer at least a week before the Germans launched their offensive into the Ardennes.

Patton directed that the prayer, along with his Christmas greeting to the Soldiers of the 3rd Army, be printed and distributed just before Christmas. The printing job was immense. Virtually every Soldier in the 3rd Army was to receive a copy so hundreds of thousands of copies needed to be printed, and printed fast. The job was beyond the capability of the printing services available within the 3rd Army Adjutant General’s office. Chaplain O’Neill discussed the requirement with the 3rd Army Engineer and the decision was made to have the 664th Engineer Topographic Battalion, with its multiple large format offset presses, execute the print mission.

ba3f3-pattonsprayer1

 Patton’s Prayer printed on the back side of his Christmas greeting to the Soldiers of 3rd Army

d2396-pattonsprayer2

 Patton’s Christmas Greeting to the Soldiers of the 3rd Army

By December 14th 1944 the prayer was distributed throughout 3rd Army. On December 16th the German Army launched operation ‘Wacht am Rhein’ (‘Watch on the Rhine’) or as we refer to it today, the Battle of the Bulge. Hitler’s plan was to attack west through the Ardennes region in Belgium, capture the port of Antwerp, split the Allied armies in two and force the Americans and British to accept a separate peace. Within 24 hours of being notified of the German offensive Patton turned the entire 3rd Army 90 degrees and raced north to relieve the trapped forces. Patton smelled blood; the Germans had stuck their neck out and he intended to cut it off.  But he still had to contend with the weather.

For seven days the American forces trapped in the Ardennes pocket struggled to hold back the German onslaught, but were denied close air support due to the foul weather. Then suddenly, unexpectedly, on December 23rd the weather cleared. Allied aircraft could range freely over the Ardennes and they extracted a fearsome toll on the Germans. At the same time 3rd Army forces smashed into the southern flank of the German pocket, shattering and all but destroying the enemy forces before it. The German Army never recovered from the Battle of the Bulge and ‘Wacht am Rhein’ was the last offensive ever mounted by Hitler’s military.

Patton was convinced that the prayer, as applied by 3rd Army Soldiers, was instrumental in changing the weather in the Allies favor. In Patton’s mind it was confirmation that God was on his side and on the side of the 3rd US Army. For his part in composing the prayer Chaplain O’Neill was personally awarded the Bronze Star medal by Patton.

The story of Patton’s prayer is important to me for two reasons. First, the images of the card you see above are those of an original card issued to my uncle, Captain Andy Harbison. Andy was a battery commander in the 176th Field Artillery Battalion which was operating in General Support of 3rd Army. He signed the card and sent it home to my Aunt Dorothy (Dottie) Harbison in Buffalo, NY.

This extract from the 176th’s field log highlights the battalion’s involvement in the Battle of the Bulge.

176th FA Bn log

The second reason is the 664th Engineer Topographic Battalion’s involvement in the printing of Patton’s prayer. While not a ‘mapping’ mission, it still represents a fascinating piece of US Army WWII topographic history. Almost 39 years to the day after General Patton ordered these cards printed I reported for duty with the indirect successor of the 644th Engineer Topographic Battalion. As a young Engineer officer I found myself assigned to the 649th Engineer Battalion (Topographic) in Schwetzingen, Germany. The 649th provided topographic support – mapping, survey, terrain analysis and map distribution – to all US Army forces in the European theater. A tenuous connection perhaps, but I like to think that I am part of the legacy of units that helped the US Army achieve victory in WWII.

Like General Patton let me wish you all a Merry Christmas in the firm belief that the Good Lord is on our side.

– Brian

Fort Meigs

I spent my teenage years growing up in Maumee, Ohio, on the banks of the Maumee River just south of Toledo. Maumee is a lovely little town that has changed little since my family moved there in the early 1970s. The northwest Ohio region and the Maumee River played an important role in the early history of the United States. The river’s direct connection to the west end of Lake Erie made it a key transportation and trade route into what at the time was referred to as the Northwest Territories.  The British had long considered the territory as Indian land and only maintained military and small trading outposts in the region. White settlement was strongly discouraged. However, at the close of the American Revolution the British ceded control of the region to the Americans (although they took their sweet time getting out of town) and European settlers lost no time spilling over the Appalachians and on into the new territories.

In 1787 Congress passed the Northwest Ordinance of 1787 that formally opened the region to settlement (and not coincidentally established the concept of public land sales as a way for the cash starved federal government to generate some revenue). Very quickly Lake Erie and it’s major tributaries became critical territory and conflicts frequently flared up as American, British and Indian interests intersected and collided in what was effectively the new American frontier. For thousands of years the Native Americans had used the Maumee River as a major trade route. The European powers and the new American republic recognized the river as the western gateway to the rich lands of the Ohio Country interior (today’s western Ohio, Indiana and lower Michigan). All sides considered control of the waterway a strategic necessity.

The Maumee River basin drains regions of three states

After the close of the American Revolution the British never really vacated the region. They maintained a number of outposts in places such as Detroit (yes, that Detroit) and Fort Miami near the city of Maumee, conducted a regular business of illegal trade with the local Indians and did a lucrative side business in fomenting anti-American sentiment among the tribes of the Western Confederacy.

Sadly, today all that’s left of Fort Miami are some low triangular mounds that trace the outline of the stockade

This all erupted into the Northwest Indian War, culminating in 1794 with the Battle of Fallen Timbers just a few miles away from Fort Miami. The American general, ‘Mad’ Anthony Wayne decisively defeated the tribes of the Western Confederacy on a piece of terrain marked by a tangle of trees that had been blown down during a violent storm. The Indians retreated towards what they thought would be refuge with the British garrison at Fort Miami, but the British commander refused to open the stockade. The surviving Indians scattered and the war was over. Not long after the British abandoned the fort and marched north into Canada.

Nineteen years later the British are back. It’s 1813 and the War of 1812 is raging. The Lake Erie basin is a critical theater of operations. The Americans have decided to invade lower Canada and move to establish a fort and supply depot on the Maumee River to support the invasion. The commander, General William Henry Harrison, selects a spot on a bluff on the south side of the river that overlooks the first set of rapids. These rapids serve as a natural choke point for any boats, barges, canoes or naval vessels trying to move upstream from Lake Erie. It is an ideally situated fort, and whoever controls it also controls all movement on the river. The British want it, and want it bad.

The fort was named Fort Meigs after Ohio governor Return J. Meigs. The fort was originally garrisoned with a few Regular Army troops and Ohio militia. Construction started in February 1813 and just two months later the fort was placed under siege by British forces that had marched down out of Canada and re-occupied the old Fort Miami stockade. Forts Meigs and Miami were located a mere two miles from each other, on opposite sides of the river.

Fort Meigs has been rebuilt and is now an active historical museum site

The siege was broken when 1,200 Kentucky militia moved up from Cincinnati and followed the Maumee River to the fort. In May of 1813 a series of short, sharp ground skirmishes resulted in the defeat of the British and their Indian allies, and the British abandoned Fort Miami. It’s this first siege, and the Kentucky militia’s involvement, that bring us to the real point of this post. (Took me a while to get here, didn’t it?)

Part of the record of the siege is a vividly detailed battle map drawn up by an officer of the Kentucky Militia, Captain William Sebree. Seabree was the commander of a company of infantry that drew most members from around Campbell County, Kentucky. The company was designated the 8th Company of the 10th Regiment, Kentucky Light Infantry that was commanded by Lt. Col. William Boswell. Indications are that Sebree compiled his map after returning to Kentucky at the end of the war. However, the amount of detail in the map – both the cartographic representation of natural and man made features and the written depictions of the flow of the skirmishes and battles – makes it clear that Captain Sebree was working from a rich collection of original material. Certainly he kept a detailed journal while in command and also had copies of his company’s daily logs and reports. He likely also had access to the regimental papers and solicited input from other unit commanders and common soldiers. What emerged was less an authoritative battle map and more a piece of patriotic folk art that still manages to convey in some detail the ebb and flow of battle.

FT Meigs

 Captain William Sebree’s ‘Plan of Fort Meigs’ and It’s Environs’ (click to enlarge)

The map shows that Sebree had an eye for hard military detail, such as the detailed depiction of the Fort Meigs stockade area:

FT Meigs Stockade

 (Click to enlarge)

Or the details of the British artillery positions just across the river from the fort:

FT Meigs - British Artillery Positions

 (Click to enlarge)

But he couldn’t resist a bit of patriotic sentimentality:

FT Meigs - Burying Place

 (Click to enlarge)

And a good bit of artistic embellishment – mounted Indians, boats on the river, trees bending in the breeze, and dogs (dogs?):

FT Meigs - Artistic Elements

 (Click to enlarge)

It’s clear Captain Sebree was not a trained topographer. Many topographic details are badly out of proportion and he makes use of different scales:

FT Meigs - Scales

There is no north arrow or compass rose (on this map, north is to the right). But there is perhaps the more important (to Sebree) ‘all seeing eye’ with the phrase annuit coeptis (Providence favors this endeavor). This symbol is taken from the Great Seal of the United States, adopted around 1782, and was in common use in the early 19th century. However, it may also indicate that Captain Sebree was a Mason, and the first authorized Masonic Lodge in northwestern Ohio was organized by the American officers stationed at Fort Meigs in 1813. It is highly likely that Captain Sebree was a Mason (as were many officers of his time) and a member of this lodge. This is all speculation on my part, but I think the threads are there.

FT Meigs All Seeing Eye

The map appears to be a commercial product. It’s a mix of set type and what looks to be woodcut printing. My guess is that Captain Sebree had these printed for commercial sale to a public eager for a memento of America’s glorious victory over the British and their Indian allies, or he sold copies by subscription. However, I know of only one existing copy that is in the Library of Congress map collection.

It seems Captain Sebree was an adventurous fellow. He was born in Virginia in 1776, migrated to Kentucky and settled in Boone County, studied law after the war and eventually moved to Pensacola, Florida where he was appointed the federal marshall for the territory of West Florida. He died in 1827 of yellow fever and is buried in Saint Michael’s Cemetery in Pensacola.

Dan Wilkins runs a great blog about the War of 1812 and has a section devoted to Fort Meigs and the events that took place there. I lived in Maumee for almost 10 years and have a deep interest in the history of the fort and the battles that took place around it. But until I read Dan’s blog I had no idea that remnants of the original British canon pits dug during the first siege were still visible in the old Fort Meigs Cemetery just east of the fort. If you have any interest in the War of 1812, and in particular the events that took place in the Northwest Territory, I recommend you spend some time taking a look at Dan’s writings.

– Brian

Stonewall Jackson’s Topographer

A few days ago my old friend Jim, unreconstructed Southerner (from South Jersey) and full-time VMI (Virginia Military Institute) alumni, let me know that there’s a new book out on VMI’s most well known professor, Thomas ‘Stonewall’ Jackson.  It’s titled ‘Rebel Yell: The Violence, Passion and Redemption of Stonewall Jackson’ by S. C. Gwynne.  Jim read an on-line review of the book and commented on how the article mentions Jackson’s keen ability to ‘read the battlefield’.

In previous blog posts I’ve discussed how great military tacticians and strategists have what seems like a God-given ability to read the ground. The ability to look at a particular battle space and know intuitively how forces will array either in the attack or the defense is the mark of a great battlefield commander.  Patton had that ability.  So did Napoleon, Robert E. Lee and Erwin Rommel. Stonewall Jackson was a master of the art, and perhaps one of the best operational-level commanders ever to take to the battlefield.  Jackson was like a mighty sword in Robert E. Lee’s right hand, and the best thing to happen to the Union Army was Jackson’s death on May 10th, 1863.  Had Jackson still been alive and in command of his Second Corps of the Army of Northern Virginia in July of 1863 Gettysburg would likely have turned out very differently.

As an operational commander Jackson realized he couldn’t take it all in from the saddle of his horse.  He understood that he needed good terrain intelligence in the form of accurate and detailed maps. Jackson was fortunate to gain the services of a talented topographer named Jedediah ‘Jed’ Hotchkiss.  Hotchkiss was a transplanted New Yorker who was running a school in the Shenadoah Valley when the Civil War broke out. He was also a self-taught topographer, geologist and engineer.  Hotchkiss offered his services to the Confederate Army and soon found himself serving on Jackson’s staff as his chief topographer and reaching the rank of Major.

Jedediah_Hotchkiss

 A post-Civil War photo of Jedediah Hotchkiss

Hotchkiss had a deep knowledge the Shenandoah Valley and used that knowledge to produce extremely detailed and comprehensive maps to support Jackson’s movements. But Hotckiss didn’t just make maps. Jackson so trusted his topographer’s knowledge of the ground and tactical abilities that he often had Hotchkiss lead columns to their objectives. Hotchkiss’ mapping and leadership skills quickly came to the attention of Robert E. Lee and copies of his maps were used extensively by Lee’s headquarters staff. In fact, it was Hotchkiss who reported the news of General Jackson’s wounding at Chancellorsville to Lee.  While Hotchkiss remained with the Second Corps staff until the end of the war he was often called upon by Lee to conduct specialized mapping and reconnaissance missions in support of larger Army of Northern Virginia operations.

At the war’s end Hotchkiss reputation was so well known that General Grant allowed him to keep possession of his maps. After the war Hotckiss’ maps were used extensively by the Federal Government when preparing the Official Record of the Civil War.

The Library of Congress acquired most of Hotchkiss’ map collection in 1948 and it is now one of the centerpieces of the Library’s Civil War map collection. In 1948 the Library published an excellent short biography of Hotckiss’ wartime mapping activities. His maps are true works of art and represent some of the finest battlefield cartography to emerge from the Civil War.

Hotchkiss1

 Enlarged section of a small scale (≈ 1:250,000) map showing the terrain between Harper’s Ferry and Martinsburg

Hotchkiss2Part of a series of maps Hotchkiss prepared detailing the disposition of forces during the Battle of the Wilderness

Hotchkiss Notebook

Detail from Hotchkiss’ notebook while working on maps showing positions of Second Corps engagements, 1864 – 65. This sketch was most likely done while on horseback and shows the incredible detail Hotchkiss put into his initial field sketches. Also note the place names with varying orientations, some appearing upside down. This is because the sketchbook would be rotated so the direction of travel is always ‘up’. Hotchkiss penciled in the place names so they appeared in the proper orientation based on his direction of travel while on horseback. When this field information was transferred to a larger compilation map the cartographers would place all place name data in the proper orientation

After the war Hotchkiss returned to his beloved Shenandoah Valley and continued his teaching and engineering professions. He became a successful businessman and an honored member of the Staunton, Virginia community. He died in Staunton in 1899. On his death his Civil War map collection was donated to the Handley Regional Library in Winchester, Virginia and in 1948 was moved to the Library of Congress.

The Geography and Map Division of the Library of Congress has made most of the Hotchkiss collection available for viewing on-line (just click this link). Spending some time on the site will give you an appreciation for the talent and contributions of this important wartime topographer.

– Brian

Terrain Models

WWII Terrain Model Making

Models.  No, not the gal.  What she’s working on.  This is a shot of a WWII defense worker creating a 3D terrain model based on the aerial photo she’s holding in her hand.

The US Army (and, I suspect, the Marine Corps) loves terrain models, and the use of terrain models for operational and tactical planning, from Army corps all the way down to squad level, has been part of our doctrine since before WWII.

Utah Beach Terrain Model

 US Army officers and NCOs studying a terrain model of Utah Beach before the D-Day landings in June, 1944

A terrain model is nothing more than a 3D representation of a portion of the earth’s surface. For the US military it serves as an adjunct to the topographic map and helps Soldiers better visualize the steps or phases of the operation they are about to execute.

A terrain model can be something as simple as an impromptu sand table scratched out on the desert floor by a squad leader somewhere in Iraq, or a highly accurate, scaled and detail correct product built by modeling experts.

Impromptu sand table

 An impromptu ‘sand table’ set up by a small unit leader to walk his Soldiers through a tactical operation. The white tape represents roads and the boxes and ammo can represent the various buildings. Crude, but effective

One of the best examples of a professionally done military terrain model is the prison camp model code named ‘Barbara’ that was built to support the US Special Operations raid on the Son Tay Prison camp in North Vietnam. The model was built by professional modelers working for the CIA and was based on Corona satellite and SR-71 reconnaissance photos.  Even the heights and crown diameters of the trees in and around the compound were properly scaled so the pilots could evaluate the best areas to set their helicopters down.

SonTay Raid Terrain Model 'Barbara'

 The terrain model code named ‘Barbara’ that was constructed in 1970 to support the planning for Operation Ivory Coast, the raid on the Son Tay prison camp in North Vietnam. The goal was to free American POWs reported to be imprisoned there. While the raid found no prisoners it was considered a success because it was executed without a hitch and so unnerved the North Vietnamese that they instituted better care and prison conditions for all American POWs

And sometimes your ‘allies’ are so lacking in map reading and military operational skills that the only way to get the point across is to walk them through the operation using a terrain model.

3rd Battalion, 3rd Marines terrain model in Afghanistan

3rd Battalion, 3rd Marines in Afghanistan, walking members of the Afghan National Army and Police through the phases of a joint military operation using a terrain model

While the use of sand tables and terrain models is ingrained in how we train our small unit leaders, doctrine addressing just who was responsible for building the more formal and complex terrain models was always lacking. The problem I frequently ran into as a Terrain Analysis Technician (Warrant Officer) in charge of small detachments of enlisted Terrain Analysts was that our commanders frequently associated ‘terrain analysis’ with ‘terrain model’ and assumed that making terrain models was my job. I actually had one Engineer brigade commander lecture me on how he knew with absolute certainty that terrain analysis units were specially trained in making terrain models and that we even had special modeling equipment as part of our equipment authorization. It also didn’t help that we often had talented artists in our terrain analysis units who enjoyed making terrain models and would often sell their services around the command headquarters. (Yes, I’m talking about you, Mark Nielander!)

There was a US Army Forces Command (FORSCOM) regulation that prohibited using Army terrain analysis and topographic units to make terrain models, but that never slowed down eager senior commanders who just couldn’t live without a terrain model. In one memorable episode in the mid-90’s the III Corps Commander at Fort Hood, LTG Tom Schwartz, directed a large scale terrain model of our operational area in Korea be set up inside the headquarters building for an upcoming joint exercise. My boss, the III Corps G2, looked me in the eye and said “get it done”.  I helpfully passed him a copy of the FORSCOM regulation. Without even glancing at it he dropped it into the trash can, looked me in the eye again and said “get it done”. Yes sir, yes sir, three bags full.

Thankfully the Deputy G2 had wrangled a bunch of sharp NCOs from both the G2 and G3 sections to do the actual work, so all I did was advise.  Over the Christmas 1995 holiday season a terrain model of the central Korean peninsula emerged that filled the entire floor of one of the headquarters building atriums (and if you’ve ever been in the III Corps headquarters building you know how big that space is). It was made out of crushed newspaper and spray foam insulation, with hand painted details. The G2 even had little airplane models buzzing overhead on special wires to represent the early UAV systems he had at this disposal. The model was so big that our standard laser pointers didn’t have the power or reach to highlight the key areas. One of our sharp NCOs ran over to the post theater and borrowed a portable theater light with a spot filter. We set the light up on the second floor of the atrium overlooking the terrain model and used that as the ‘pointer’.

By the time model was done it was like a carnival sideshow, with folks from near and far dropping in to marvel at what had to be the most outlandish and cheesy terrain model ever built. General Schwartz loved it.

Today the digital world is awash in ‘terrain visualization’ software. Given the high resolution imagery and elevation datasets available for just about anywhere our military forces fight it is easy to generate realistic and accurate computer models almost on the fly. But still, nothing satisfies like a physical model (just like nothing satisfies like a paper map). That’s why digital-to-solid terrain modeling systems have come on strong in the past several years.  As this picture shows, when you’ve got to gather up a bunch of folks to look at a key piece of terrain nothing fits the bill like a real terrain model.

Fort Irwin Terrain Model

A solid terrain model of Fort Irwin, California, generated from digital data by Solid Terrain Modeling, Inc. The model was first shown at the 2003 ESRI International User Conference in San Diego. Since this show the technology has gotten faster, cheaper and easier to use

So what’s on the horizon? I’m waiting for the first cheap desktop solid modeling printers to hit the market so I can crank out 3D models of my favorite fishing holes. Canon? Epson? HP? Anyone?

– Brian


Calculators

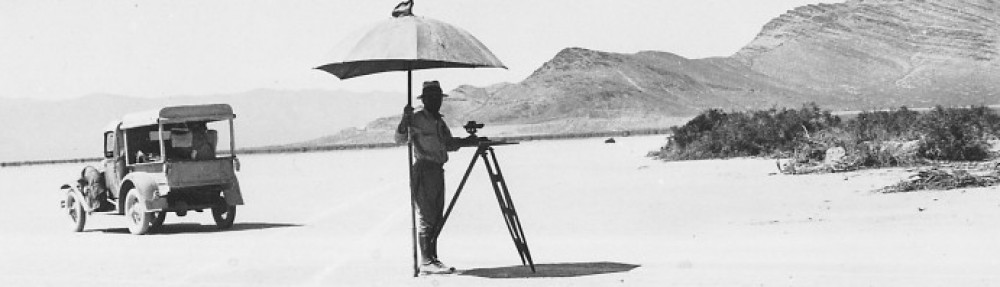
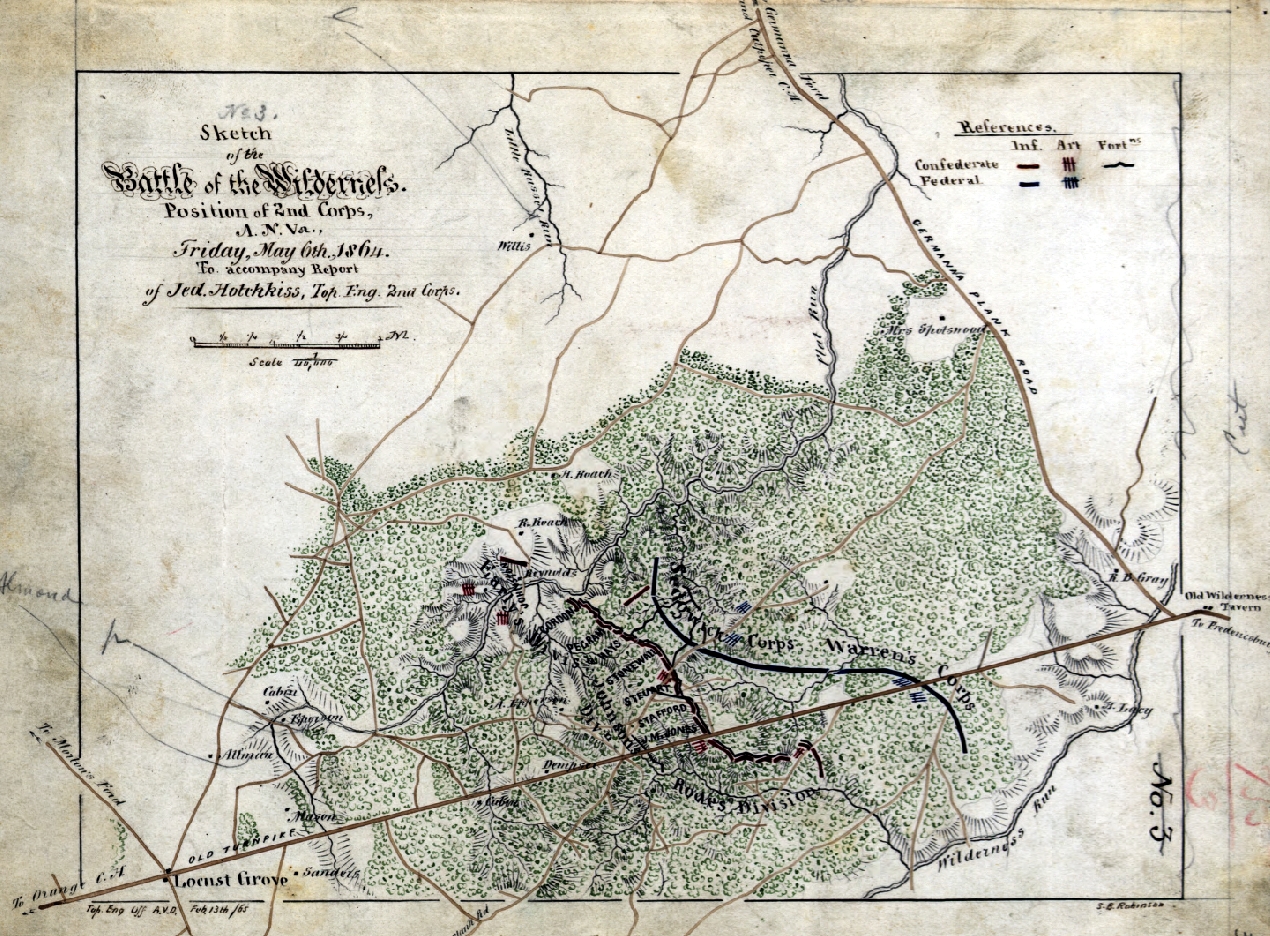
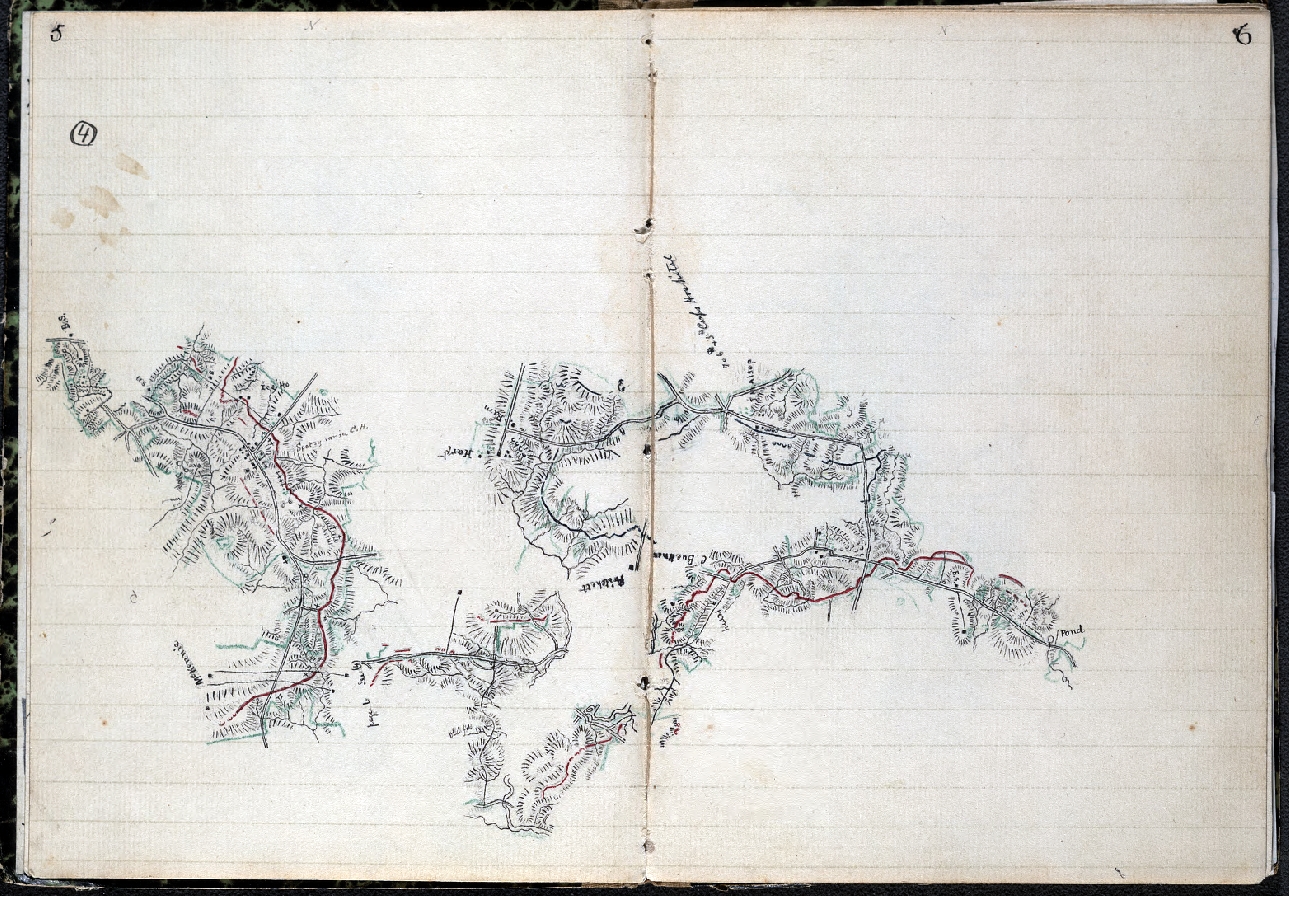
The topographic sciences are a math intensive endeavor. Map making is far more than drawing squiggly lines on a sheet of paper. Before those squiggly lines get drawn there first must be a determination of things like the geographic extent of the map, the scale, the coordinate system and projection and the precise location of key features on the map. This all has to be figured out before the first line is drawn. This means number crunching, lots and lots of number crunching.  A competent topographer needed to be conversant in everything from plane geometry to matrix algebra to calculus.

Today all of the complex math involved in map making is easily and swiftly handled by computers. A mouse click or two in a multi-threaded 64-bit desktop application launches a routine that returns a mathematical solution in seconds. But just 60 years ago the same routine would take a competent topographer or mathematician hours to calculate by hand and would involve the use of special forms, books full of mathematical tables, slide rules and, if he or she was lucky, a hand cranked mechanical calculating machine that might be able to hold precision to a decimal place or two.

There was a time not long ago that the accuracy of these calculations was so important that the job of ‘calculator’ was something that a young man or woman with good math skills could make a decent living at. For example, in the US Geological Survey (USGS) the topographic or geodetic survey crews would collect the data in the field and do some initial accuracy checks just to make sure they hadn’t ‘busted’, or obviously exceeded the required accuracy for the type of survey the were conducting. All the data would then be sent to a USGS field office or headquarters where the specially trained ‘calculators’ would re-evaluate the data to provide a final approved result.

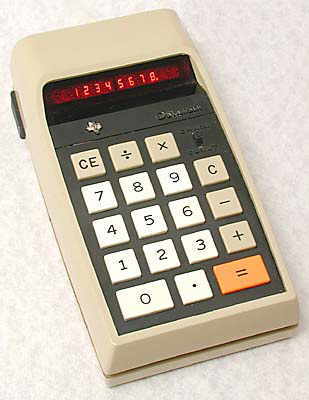
About 40 years ago there was a paradigm shift in the topographic field that was brought about by the introduction of (relatively) inexpensive handheld calculators. It’s hard for those who didn’t live through this time to understand just how big of an impact the handheld electronic calculator had on the scientific and engineering world, and this included the topographic sciences. My father was (and still is!) a chemical engineer, and I remember watching him sit at the table after dinner grinding through stacks of engineering calculations with a slide rule and long calculation sheets. One day in the mid-1970’s he went out to the local J.C. Penneys and came home with a new device that fundamentally changed how he worked – a simple ‘4-banger’ Texas Instruments calculator, probably the TI-2500 ‘Datamath’ model.  All it did was add, subtract, multiply and divide (hence the ‘4-banger’ designation) and at $119 dollars (equivalent to $575 today) it was a significant investment, but the improvement in accuracy and speed of calculations made the investment worthwhile.

TI25002_1

 Texas Instruments TI-2500

From there things only got better.  While desktop computers were still just pie-in-the-sky devices we saw on the weekly episodes of Star Trek, handheld calculators quickly started dropping in price while adding newer and more advanced features. Faster and cheaper processors, better displays, better batteries, storage registers (i.e., memory), statistical functions, angular calculations, exponent calculations, continuous memory, programming, symbolic equations, alpha-numeric registers, unit conversions and a lot more. By the time I started college in early 1975 I could pick up a feature rich Texas Instruments scientific calculator like the SR-50 for a little over $50. This calculator offered all the capabilities a financially and academically struggling student needed for most of his college career.

In the early 1970’s a new player emerged onto the calculator scene. Hewlett-Packard (HP) was a highly regarded electronic test equipment and computer manufacturer that had released some very successful desktop calculators and mini-computers in the late 60’s and early 70’s. One of the company’s founders, Bill Hewlett, was watching the emerging calculator market and challenged his engineers to come up with a calculator designed specifically for scientists and engineers that would fit into his shirt pocket. Even though HP’s marketing group didn’t think it would sell, Bill pushed the project forward and in 1972 HP released the HP-35. It took the scientific and engineering world by storm. The marketing gurus said HP would never sell more than 10,000 units, total. In the first year alone HP sold over 100,000 and when production of the HP-35 ended in 1975 it had sold over 300,000. That’s pretty impressive sales numbers for a calculator that cost over $2,000 in today’s dollars!

HP 35 Calculator

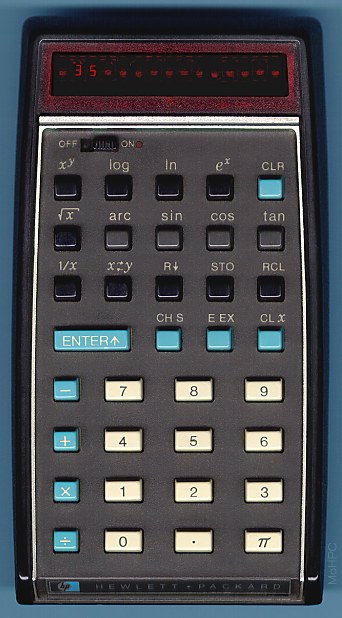
 The HP-35 Scientific Calculator

The HP-35 set the standard for all HP calculators that followed. Rugged construction, high reliability, excellent documentation and support, well implemented features and the unusual but very efficient computational system known as Reverse Polish Notation (RPN).

As a young college student I was well aware of HP’s offerings. The calculators were offered for sale in the college bookstore where I was studying and HP ads were appearing in a lot of the magazines I regularly read (like Scientific American). In addition, HP would ship you large envelopes stuffed full of promotional material and copies of the company’s magazine devoted specifically to it’s calculators and their use. At the time my brother worked at a test lab in Toledo, Ohio and would bring home one of the early HP-21’s that the lab owned just to play with. I was hooked, but there was no way a poor college kid was going to be able to afford a calculator that cost at least four times what my Texas Instruments calculator had cost me.

Fast forward a few years to 1982 and I’m out of college, in the Army Corps of Engineers and reporting to the Defense Mapping School at Fort Belvoir, Virginia, to attend the Mapping, Charting and Geodesy Officer’s Course (MC&GOC). On the first day the course leader handed each of us an HP-31 calculator and gave us a fast course in Reverse Polish Notation and stack manipulation. Then it was off to the races, with the first part of the course covering survey theory, statistics, matrix algebra and least squares. Since the Army was paying me a little extra each week to attend the class I figured it was time for me to buy my own HP calculator. One Saturday morning I took the Metro to an office supply store in downtown DC and bought myself a brand spanking new HP-32E.
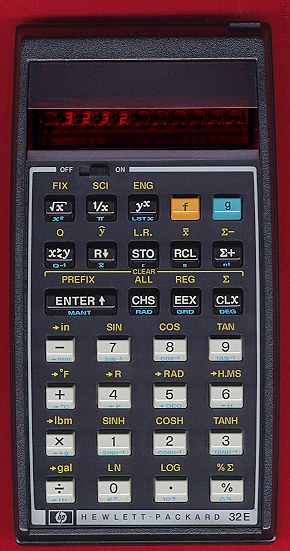
HP 32E Calculator

HP-32E

That purchase triggered several decades of HP calculator accumulation. I can’t claim that I ‘collect’ HP calculators since I rarely go looking for them.  However, if one happens to fall into my lap – usually from a co-worker looking to get rid of an old unit or I stumble on one in a pawn shop or at a yard sale – I’ll pick it up and add it to my stash.

I’m sure some of you are asking yourselves, “But does he still use any of those calculators?”  You bet! While high end GIS software and spreadsheet programs have taken over most of the heavy number crunching I do, I still keep a modern HP 35S, on my desk for those ‘right now’ calculation needs that crop up almost daily. In addition I run HP calculator emulators on my iPhone and Android devices that have proven themselves very useful when in meetings and someone needs quick averages run on a series of numbers, or some quick sums done, or a rough comparison between estimates calculated. The handheld calculator is still a very useful tool!

Let’s take a look at a few calculators in my collection and discuss their significance:

TI 59 Calculator

Texas Instruments TI-59

This is one of the few non-HP calculators in my collection, but it’s here for two reasons. First, this particular calculator used to belong to my father, who used it in the latter stages of his professional career.

The other reason I include it is because it represents an interesting example of how technology advances regardless of what the powers-that-be want. In the early 1980s I was attending the Air Load Planners School at Fort Bragg, where we learned to do aircraft load and balance configurations for our unit’s wheeled and tracked equipment. A couple of my classmates were out of the Field Artillery battalions on Fort Bragg and all were using TI-58 or 59 calculators. During a break one day I asked them where all the TI calculators came from. They told me that the calculators actually belonged to their units and were used as unofficial (and unapproved) replacements for the big, bulky FADAC computers the Field Artillery units used to calculate indirect artillery fire. The FADAC was 1960’s technology that took up an entire table, required a 10 kilowatt generator to power and cranked out enough heat to fry an egg. In the early 1980’s some sharp young lieutenants at the Field Artillery School figured out that all the computations the FADAC system did could be easily handled by the TI-59. Since the TI-59 was one of the earliest magnetic strip programmable calculators it was easy to copy all the calculation routines to the strips and share them around. Local Field Artillery units snuck out and locally purchased TI-59 calculators and began using them in place of the FADAC systems. This was particularly advantageous for light artillery units in the 82nd and 101st Airborne Divisions since they could carry ‘FADAC-lite’ capability in their rucksacks.

HP 41CV Calculator

 HP-41CV

The HP-41 calculator was out of this world – literally.  More on that in just a bit.

When HP introduced the HP-41 in 1979 it appeared to make all previous HP models obsolete. Not entirely true, but that’s the impression it gave. A lot of engineers and scientists chucked their old calculators, took out loans and bought themselves an HP-41 and accessories. Many of those calculators are still chugging along and their owners refuse to let go of them or move up to something more advanced. What made the HP-41 so good? It wasn’t HP’s first programmable calculator, or its first with continuous memory. What made the HP-41 special was that it was the first handheld calculator with an expansion interface. When you bought the HP-41 you were buying just one component of a larger system that could include dedicated expansion modules for things like surveying, electrical engineering, structural analysis or celestial navigation. You could hook it up to a floppy disk drive to write or retrieve data. You could attach a bar code reader or send your work to a printer via an infrared link. You could hook it up to sensors to monitor temperature, humidity, blood pressure, and lots more. The HP-41 was also HP’s first calculator that used an LCD display, greatly reducing battery drain, and it introduced the idea of alpha-numeric tags for programming. In short, the HP-41 was more computer than calculator.

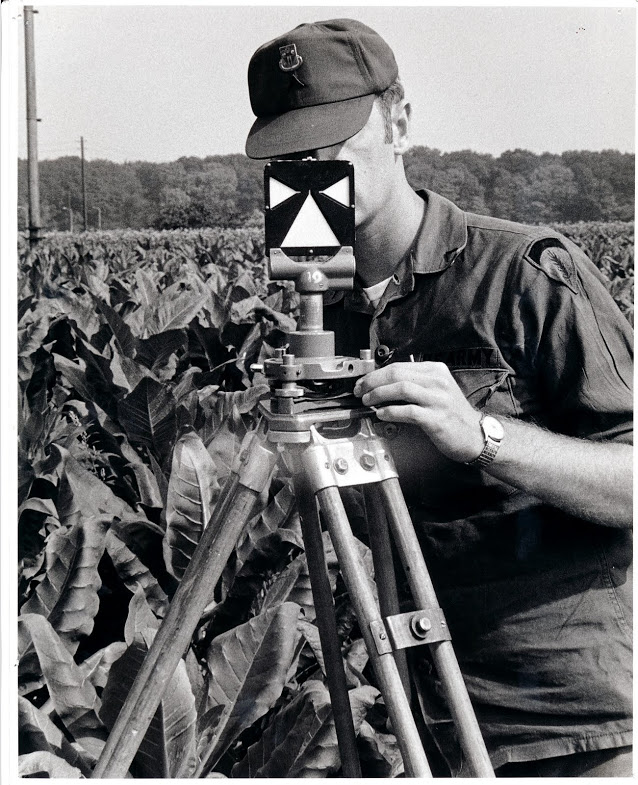
The HP-41 caught on strong with the surveying community and a lot of third party surveying applications were developed for it. Many of these calculators went to the field with survey crews and computations were run on the spot to verify collected data. The HP-41 provided the first glimpse into the future, where theodolites and computers would become integrated systems and all data collection and reduction was done on the instrument in real time.

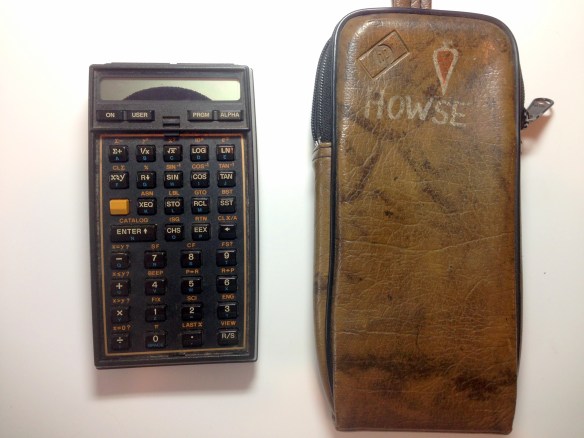
This particular calculator obviously doesn’t work, and it’s damaged beyond repair. I picked it up in my unit in Germany back in 1998. We were doing a final clean-out of unserviceable equipment left behind from the inactivation of the 649th Engineer Battalion (Topographic) and I found this calculator in a box that was headed for the dumpster. I saved it only because it had someone’s name on the case and because I didn’t have an example of an HP-41 in my collection, working or not.  So, Surveyor Howse, if you want your HP-41 back just drop me a line. I’ll be happy to return it!

Now, what about the ‘out of this world’ comment? Well, in 1980 NASA went looking for a programmable calculator that could be carried by the astronauts on the first Space Shuttle flight. The idea was to program the calculators with critical flight data and routines for the astronauts to use in case Columbia’s on-board systems failed. Each of the two pilots, John Young and Robert Crippen, carried HP-41s in their flight suit pockets. This made the HP-41 the first handheld calculator in space. Thankfully the pilots didn’t need the calculators for their intended purpose, but HP-41s flew on a number of subsequent flights, mainly as auxiliary computers to help take the computational loads off of the Space Shuttle’s overburdened computers. One of these HP-41s, used by Astronaut Sally Ride, is on display at the National Air and Space Museum.

HP 34C Calculator

HP-34C

The HP-34C is perhaps the best example of HP’s third generation of handheld calculators, and in its time was considered HP’s high end keystroke programmable calculator. None of the third generation calculators offered card reader capability like the HP-41 or HP-67, but with continuous memory capability you could key in a wide variety of short programs and run them as needed. This calculator also sports what is considered the classic HP calculator key layout, and it’s a layout that is still praised today for it’s clarity and ease of use.

HP 11C Calculator

HP-11C

The HP-10 series of calculators came out in 1981 and included the 10C, 11C, 12C, 15C and 16C. Of this group the 11C and 15C Advanced Scientific calculators were by far the most popular, and the 11C remained one of HP’s best selling calculators for years. In my office there are still civil engineers with old, battered, but functioning 11C or 15C calculators on their desks.

Both of these calculators are 11C models. The one on the bottom with the missing HP sticker has an interesting history. This is the second HP calculator I bought for myself, back around 1983 (not long after buying my HP-32E). I decided I just couldn’t live without continuous memory. This calculator was carried daily, usually in the cargo pocket of my Army BDU uniform. One day I came home from work and my lovely wife met me at the door holding a wet pair of BDU trousers that she had just pulled out of the clothes washer. She looked at me and growled, “It ain’t my fault!” and tossed me the trousers.  I knew right away she was referring to something I had left in the pockets but didn’t know what.  As I squeezed the various pockets I immediately felt the outline of my 11C and knew I was in trouble. I pulled the calculator out and was disappointed, but not surprised, to see it wouldn’t turn on. I figured I had nothing to lose by trying to resuscitate it, so I pulled out the batteries, wiped it down as best I could and put it in a nice dry location. A few weeks later I popped in a new set of batteries and hit the ‘ON’ button. To my amazement it came to life! I ran through all the built-in diagnostic utilities and it returned no errors. The calculator returned to work with me the next day.

Somewhere along the way this calculator went missing. At the time we were living in Frankfurt, Germany so I went down to the big Herite department store on the Hauptwache and purchased a new one (complete with German documentation). That calculator (the one on the top in the picture) is still running on the original set of batteries I installed in 1985! About a year later I was going through some old papers from work and was surprised to find my old, original 11C stuffed into a manila folder full of forms. It must have gotten accidentally dropped into the folder without me noticing it. So now I have two 11C’s, and both work like champs!

HP 32S Calculator

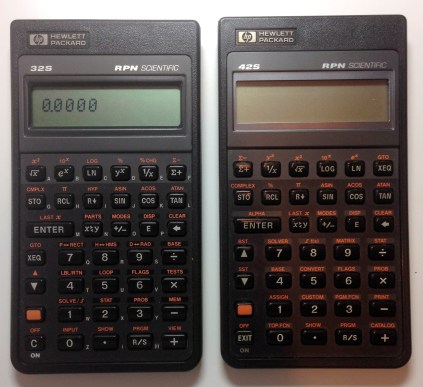
HP-32S (left), HP-42S (right)

This series of HP calculators was introduced in 1986 and was intended to replace the 10-series discussed above. Mostly they succeeded. The HP-32S remained in production for over 10 years and was actually quite a good yoeman scientific calculator. Nothing spectacular, just a very reliable, rugged calculator loaded with useful features. Its dot matrix display made it a bit hard to read in some lighting conditions, but it made better use of the built-in alpha-numeric register options.

The HP-42S is an interesting product. In 1988 the venerable HP-41 was reaching the end of its product life cycle and HP had plans to phase it out in favor of the new HP-48 series of graphing calculators. Yet HP knew that the HP-41 series had a strong, almost cult-like following and that HP-41 users would be reluctant to abandon their existing applications and programs. In an effort to bridge the gap between the HP-41 and the newer HP-48, Hewlet Packard introduced the HP-42S. Basically they ported the HP-41 ROM over to this new format and incorporated some improvements – faster processor, better display, more storage registers and a few other upgrades like a matrix editor. At first the user community took it as a joke – an HP-41 ‘compliant’ operating system on a calculator that offered no input other than keystroke programming and no output other than an infrared link to a printer. Sales were slow, and while HP kept it in production for about 7 years it never really sold well. Can you tell where this is going? Now, more than 20 years after its introduction the HP-42S is a hot collectors item. HP aficionados now recognize it as something special – a ‘hot-rodded’ version of their beloved HP-41 in a smaller and easier to use package.
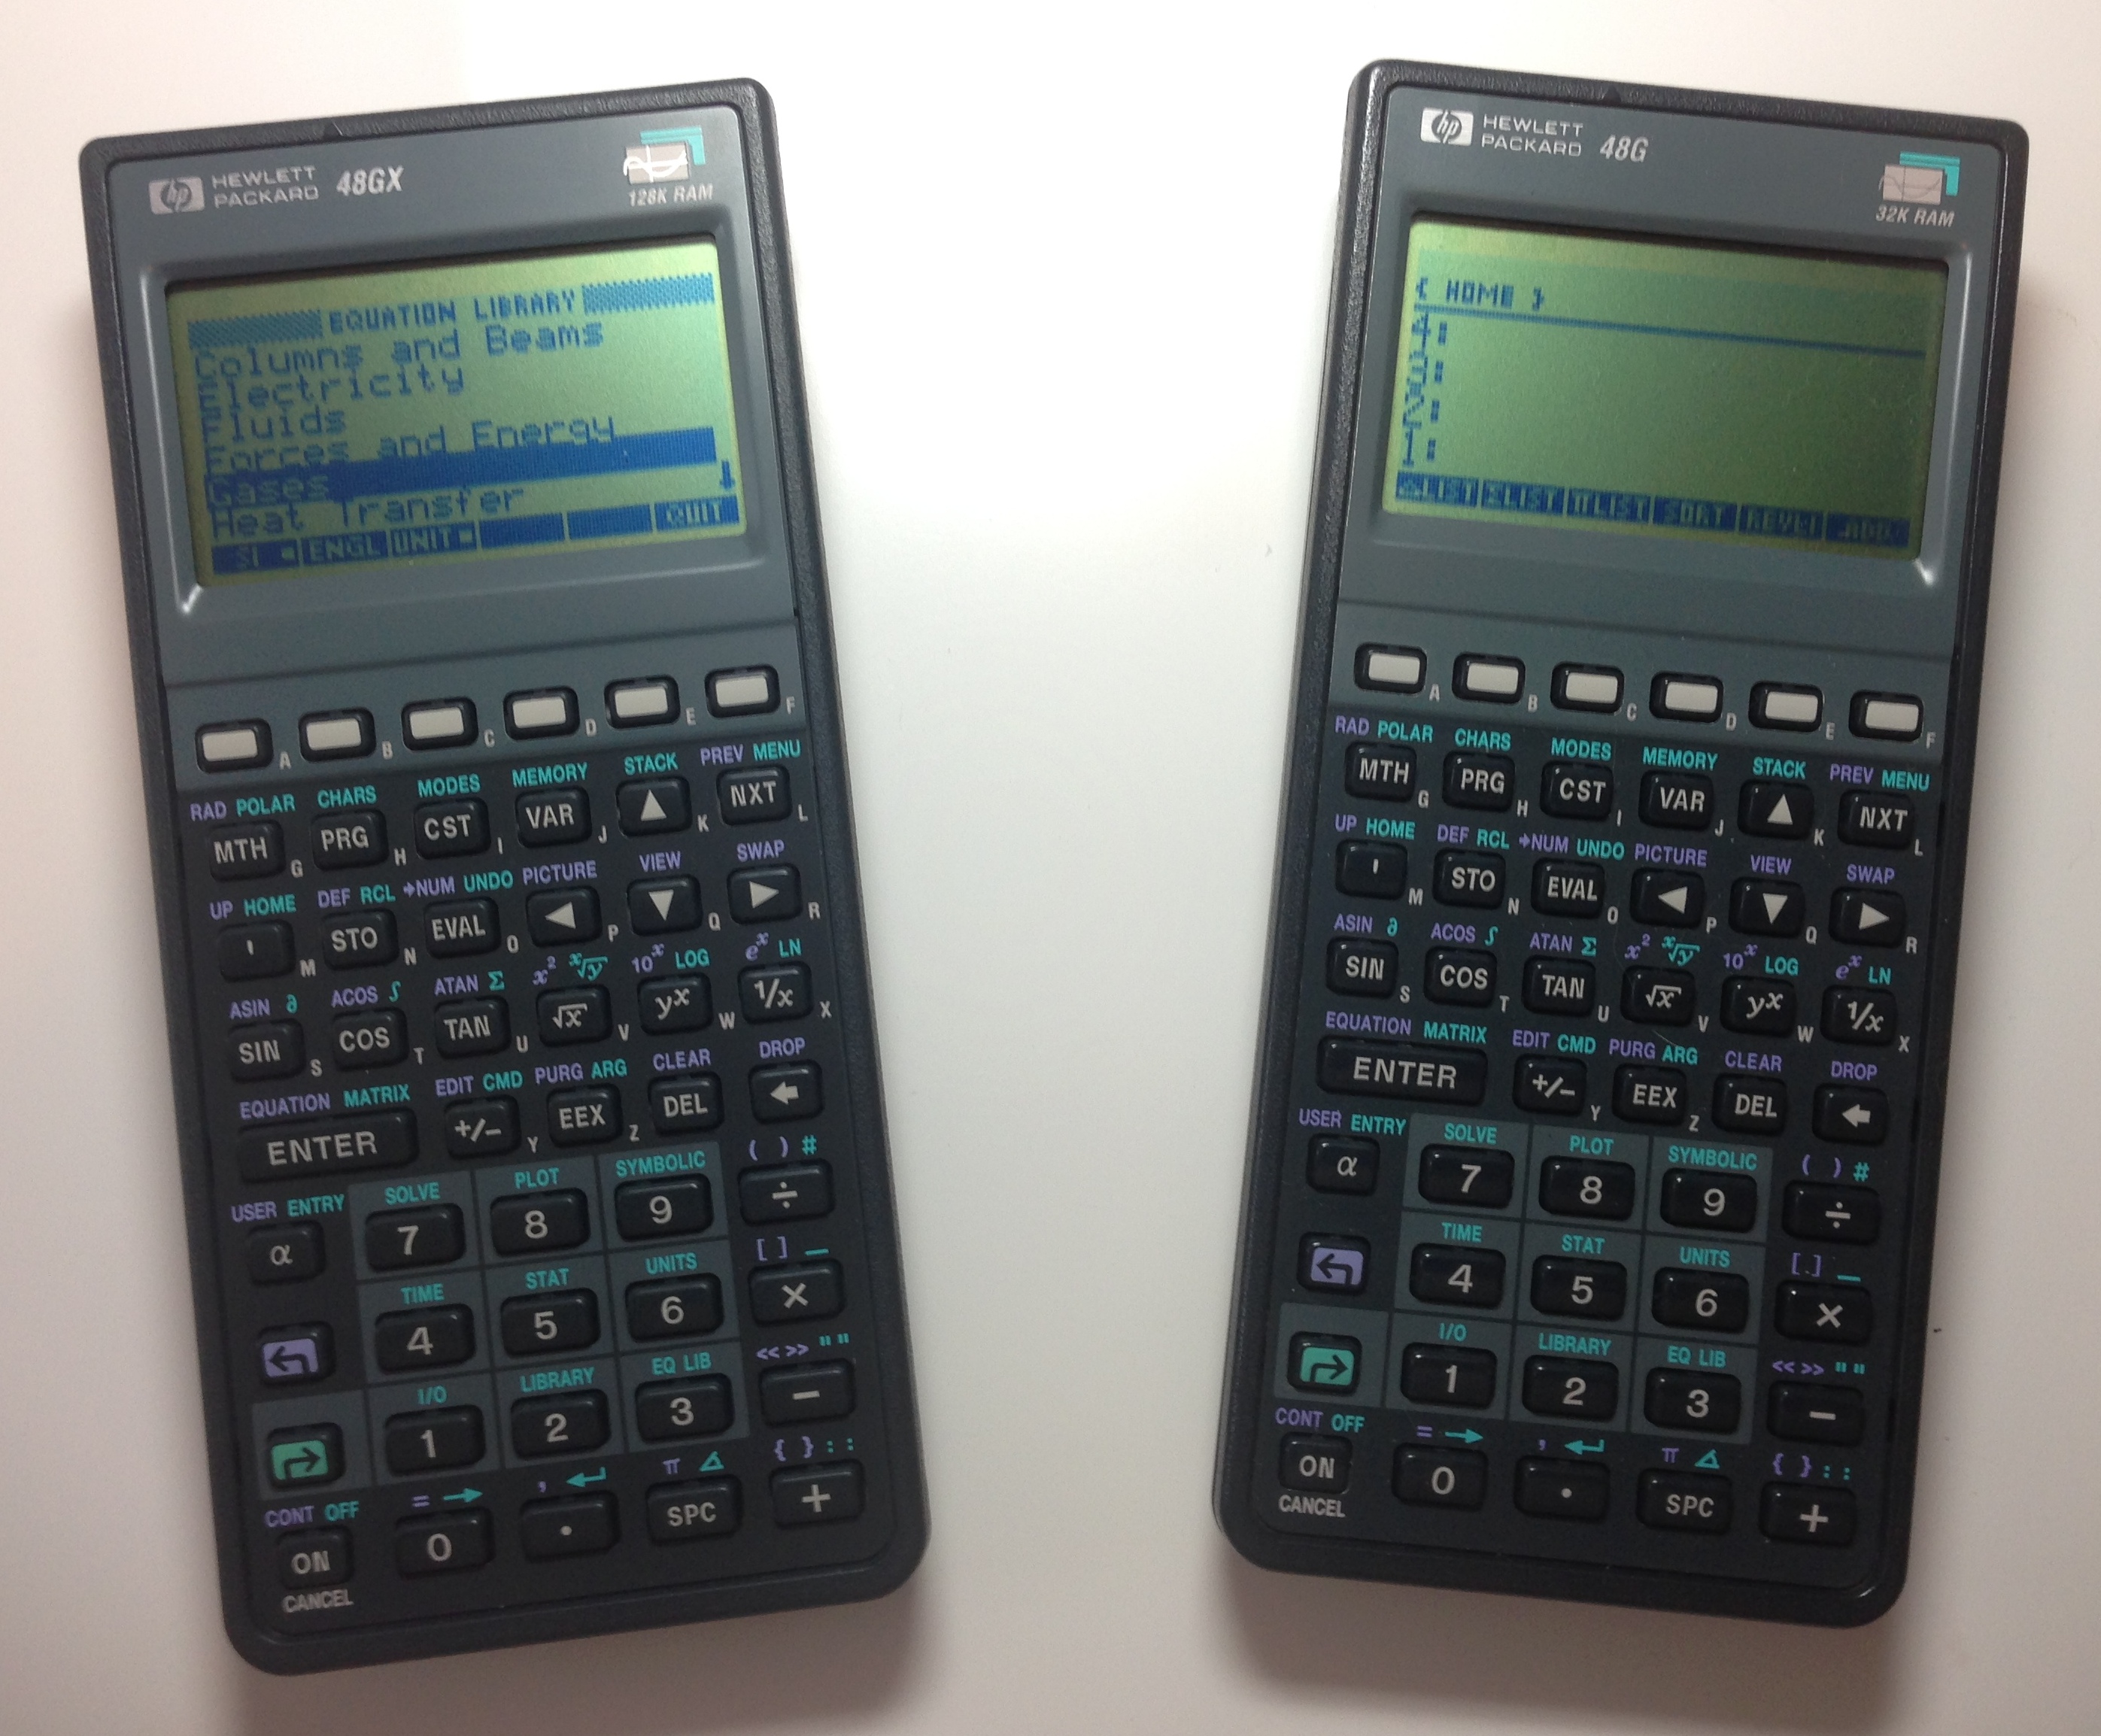
HP 48G Calculator

HP-48G Series

Let’s wrap this up with a look at what many (including me) consider to be the last of the classic HP calculators. The HP-48 was developed to replace the HP-41 series, and fully succeeded in that goal. While the HP-48’s never developed the devoted following the HP-41 series did, the HP-48 succeeded on another level – they became solid and serious workhorse calculators that found their way into a wide range of applications. They were well built, feature rich, expandable, offered great battery life (using commonly available AAA batteries) and excellent connectivity with a wide variety of devices via a standard serial cable. Survey program developers quickly took advantage of the HP-48’s power and capabilities and wrote software that turned the units into data collectors that hooked right up to early digital theodolites, making the HP-48 one of the first dedicated data collectors on the market. The calculator shipped with its own application library installed, but developers wrote hundreds of additional applications covering a wide range of subjects such as biodiversity evaluation and commercial aviation fuel load calculations. One of the HP 48’s in my collection was surplussed out of the University of Michigan Dept. of Physiology where it was used as a human bio-metric data controller. The HP-48 stayed in production for 13 years making it one of the most successful lines of calculators produced by any manufacturer. Today there are thousands still in use around the world and, like the HP-41 a generation earlier, their users refuse to let go of them.

Sadly, after the HP-48 Hewlett-Packard all but abandoned the calculator market. HP management and marketing folks didn’t see any future for handheld calculators and let the calculator unit wither on the vine. Calculator development was moved off-shore and HP’s offerings became little more than bland re-badged products produced in China. For a time HP even toyed with abandoning its signature RPN operating system in an effort to capture a share of the student calculator market dominated by Texas Instruments.

HP’s interest in calculators seemed to perk up a bit as the 35th anniversary of the HP-35 approached. In 2007 they introduced the HP-35S, a design that received a lot of input from classic HP calculator aficionados. It was a good effort that hearkened back to the classic HP calculator designs of the 1980s and runs a faithful implementation of HP’s classic RPN operating system. Since then not much has happened. Two years ago HP released a new product called the HP Prime, a high end graphing calculator that gets very good reviews, but today HP’s serious scientific calculator offerings can be tallied on the fingers of one hand.

Let’s hope we are not seeing the end of a long and storied calculator dynasty.

– Brian

We Missed The Hedgerows

It is Memorial Day and I’m thinking about those that made the ultimate sacrifice, and what might have been done differently that could have ensured many of those we lost instead made it home safe and sound.

One of the key Engineer topographic intelligence failures of WWII took place during the planning phases of Operation Overlord, the Allied invasion of France. This was the failure to properly assess the impact the hedgerows in Normandy would have on our ground movement and tactical operations. This failure to identify and assess the impact of the hedgerows, and then develop tactics and training procedures to deal with them, resulted in the unnecessary deaths of hundreds of Allied Soldiers.

The hedgerows in Normandy were used to create small pastures and farm fields, many of them just a few acres in size. In a land without rocks or trees these hedgerows were the fences that kept cattle from wandering off and allowed farmers to clearly identify what land they owned.

Normandy Hedgerow Profile

The Normandy hedgerows were made up of linear mounds or walls of earth topped by a thick tangle of trees and brush. Most of the hedgerows dated back hundreds of years, some back to the time of William the Conqueror. Centuries of soil compaction and vegetation growth meant the hedgerows were dense, sturdy obstacles that were virtually impossible to penetrate. On a flat and otherwise featureless coastal plain the hedgerows created heavily dissected terrain with limited line of sight and restricted virtually all off-road movement.

 The hedgerows of Normandy, just in from Omaha Beach, created a tactical nightmare for the US forces that landed there on June 6th, 1944


Bocage_country_at_Cotentin_PeninsulaHedgerows in Normandy as seen in an oblique aerial reconnaissance photo taken by the US Army Air Force before the invasion. In this photo the hedgerows present obvious obstacles to movement so why didn’t they get more serious analysis?


The German Army was the master of the defensive operation. We had already seen that in Italy, where German Field Marshall Albert Kesselring established a defensive line in the mountains north of Rome (known as the Gustav Line) that turned Churchill’s ‘soft underbelly’ operation into a meatgrinder that chewed up entire Allied divisions. In Normandy the local German commanders had months to study the problem and turned the hedgerow complexes into deathtraps. Every hedgerow corner, every road and trail, every chokepoint was covered by machinegun, mortar, anti-tank and artillery fire. Normandy was a defender’s paradise, and the Germans made the most of what they had. Normandy became a textbook case of a tactical defense in-depth, and the German efforts are still studied today.

U_S_Army_in_World_War_II_Photograph_of_GIs_Moving_Cautiously_Between_Hedgerows_in_Normandy

American Soldiers cautiously working along the hedgerows in Normandy to flush out German defenders


440615 hedgerows 2

 American Soldiers standing in a narrow lane between two hedgerows somewhere in Normandy. This type of terrain became an alleyway of death for Allied Soldiers who only had two options – advance directly into the enemy fire or retreat back from it. There was no going around


The Allied armies never really defeated the hedgerow problem. The advance through Normandy became a slow slog with infantrymen fighting for every foot of terrain. The US Army eventually developed a set of combined arms tactics using dismounted infantry and tanks that allowed effective movement, but in the end it was commanders like General Patton who simply decided to punch through the hedgerow country and break out into the more open terrain south of Paris. In the end the Allies simply bypassed the German defenders in the hedgerows and left them to wither on the vine. Most surrendered within a few weeks, out of food, out of ammunition and out of the will to continue the fight.

But the question remains – how did we miss the impact the hedgerows would have on our tactical operations? We didn’t lack for topographic intelligence analysis during the planning phases for Overlord. The beaches and inland areas of Normandy received some of the most intensive Engineer terrain and intelligence analysis ever applied to a piece of ground. We collected tens of thousands of aerial photos (many of them in stereo), built hundreds of terrain models and printed thousands of special maps and geographic (terrain) studies of the Normandy region. Small unit commanders had the best picture of their objectives, and the terrain leading up to their objectives, than had ever been developed for any military operation up to that time – and yet we missed the hedgerows!

There’s no definitive answer in the historical record as to why the Normandy hedgerows were not identified as significant obstacles, but I can make a few good educated guesses as to what happened.

First, there is this intriguing passage from Chapter 13, Looking Ahead To The Continent from the volume ‘The Corps of Engineers: The War Against Germany’, part of the US Army’s official history of WWII (the excellent ‘Green Book’ series):

Hedgerow Statement

The large scale topographic map is the standard military planning document. Planners at all levels – from Infantry platoon all the way up to Theater Army G-3 – rely on the topographic map to provide an accurate representation of the ground they are going to fight over. The general assumption is that if it’s not on the map it is either not there on the ground, or it’s not important enough to worry about from a military operations perspective. Yes, the map is just a base to build on, but Soldiers are trained from day one to trust what they see on the map to be an accurate representation of what they will find on the ground. If hedgerows are missing from the map, even though they may be visible in aerial photography, the assumption is that someone further up the chain with more smarts and access to better data took a hard look at the hedgerow problem and decided it wasn’t anything to worry about. This seems to have generated a false sense of security regarding the hedgerow issue that permeated all levels of Allied command.

Additionally, in the same chapter Major General Cecil Moore, the Chief Engineer of the European Theater of Operations, admitted that his Engineer staff was inadequate to the task of providing all the topographic intelligence needed to support the invasion planning. Topographic intelligence was new ground to many Engineer officers and they lacked the education, training and experience necessary to provide the support needed. This is a remarkable admission considering all the other excellent Engineer analysis that took place prior to the invasion. My guess is that Moore’s staff focused tightly on analysis of the invasion beaches, exits from the beaches and the avenues of approach to the initial objectives, and German obstacle emplacements that were visible in aerial photos. There were river crossing operations, road repairs and improvements, airfield construction, port repairs and a whole host of other critical Engineer tasks to focus on. Hedgerows, if anyone on Moore’s staff thought about them at all, were probably considered a minor issue in the overall scheme of things.

There are three other issues that I’m sure probably came into play – wishful thinking, complacency and ‘go fever’.

Wishful thinking. Having served on Army planning staffs from brigade all the way up to theater army level I can assure you that there’s a lot of wishful thinking that goes on during the staff planning process. While we train our planners to not allow wishful thinking to creep into the planning process, many times tough problems that are just ‘wished away’ on the assumption that someone else will solve it or it will resolve itself before the operation gets underway. I’ve seen this dozens of times, like when I told a tank battalion commander that his 12 foot wide Abrams tanks won’t fit down that 10 foot wide trail in North Korea that he was planning to use. He waved his hand dismissively and told me that if and when the time comes he’d find a way around the problem.

Complacency. American Soldiers had been training in England for months before the invasion, and hedgerows are a common feature of the English countryside. But the hedgerows of England are were far smaller and easier to move through or over. Most could be simply hopped over. I’m sure many unit commanders looked at the aerial photos of Normandy and based on their experiences in England didn’t think the Normandy hedgerows would be much different. After all, a hedgerow is a hedgerow, right?

‘Go fever’ is the feeling that nothing is going to be allowed to stop the show. I’m sure ‘go fever’ saturated the Allied planning staff as June 6th approached. Nobody was going to try to halt the invasion for any reason; it was going to go as scheduled regardless of any last minute issues that might pop up. When an entire Army has ‘go fever’ nothing seemingly as minor as hedgerows will stop the largest invasion in history.

It took decades for the Army Corps of Engineers to recognize that topographic intelligence analysis was a critical skill that needed formalized processes and uniquely trained Soldiers. It was actually the Army Intelligence community’s efforts in the late 1970’s to formalize the Intelligence Preparation of the Battlefield (IPB) process that spurred the Engineers to action. IPB as an analysis process is heavily dependent on weather and topographic (terrain) analysis. The Intelligence community was set to establish their own organic terrain analysis assets when the Director of the Army’s Engineer Topographic Laboratory warned the Chief of Engineers that if he didn’t get serious about Engineers doing topographic analysis a key and historic Engineer responsibility would be ceded to the Intelligence field. Soon after the Corps of Engineers established the Terrain Analysis field and seeded Terrain Analysis units across the Army division, corps and theater army force structure.

Today Terrain Analysis is known as Geospatial Analysis and it’s the last vestige of the old Army topographic field left in the Army’s force structure. Since 1980 the Army’s Terrain/Geospatial Analysts have been doing the type of detailed analysis that might just have identified the hedgerows in Normandy as a serious obstacle. Our analyst are trained specifically to look at the small stuff – the trails, the fencelines, the stands of trees, even the hedgerows that might pose a problem for even the smallest of military units.

On this Memorial Day I’m praying we never have another ‘hedgerow problem’ on any battlefield American Soldiers are deployed to.

– Brian


Map Makers At Work

I was going through some photos in my collection for some Facebook friends and ran across a collection of old shots I acquired while assigned to the 320th Engineer Company (Topographic) back in the late 1990s. I say ‘acquired’ because I just happened to find them lying around my office as part of some left over historical records from the old 649th Engineer Battalion (Topographic). All are 1970’s vintage photos that highlight the map making activities of the 649th. The 649th provided comprehensive topographic support – survey, map production & distribution, terrain analysis, and geographic intelligence analysis – to US Army Europe (USAREUR).

In the early 1980’s I was assigned to the 649th at Tompkins Barracks in Schwetizingen, Germany. I served as the commander of one of the terrain analysis detachments. I have a lot of good (and some not-so-good) memories of the 649th and the Soldiers that served in the unit. Fifteen years later I found myself back in Germany. By then the 649th had been deactivated and my unit, the 320th Engineer Company (Topographic), was the last surviving remnant of the 649th. The 320th had received a lot of left over equipment and paperwork from the 649th and one of my duties was to sort through it all to determine what was worth keeping and what could be trashed. During this process I found the photos you see in this post.

All of these photos were rejects, shots the photo editor didn’t think were worthy of using in a presentation. That accounts for a lot of the grease pencil ‘mark outs’ you see on many of the images. The interesting part is that the pictures that made it past the editor and into various publications or presentations are long gone – either packed up with the unit’s archives and locked away in an Army records warehouse or tossed into a trash can. Only the rejects survived to make it to my desk long after the battalion inactivated.

The 649th rarely made a new map from scratch. Most of the work involved updating existing maps or creating specialized overlays (like military operational graphics) to be overprinted onto existing maps. Still, the battalion had all the functional components necessary to create a new map:

  • Topographic and geodetic survey
  • Photomapping and cartography
  • Layout, photolithography and printing press operations

To accomplish these tasks each topographic company within the 649th was divided into three platoons – the Survey Platoon (topographic & geodetic survey), the Photomapping Platoon (photo control, compilation and drafting) and the Reproduction Platoon (layout, photolithography and press).

So let’s take a look at these processes as practiced by Soldiers of the 649th. This isn’t intended to be a comprehensive overview of map making; there are some large gaps in this tale simply because I don’t have any photos depicting specific steps. The real goal here is to highlight the Soldiers and their activities.


 Survey

Each map starts with two things – stereo aerial photography and a topographic survey to ‘tie’ the photos to their location on the face of the earth. Army topographic units relied on US Air Force photomapping squadrons to provide the aerial photography. Once the topographic unit got the aerial photography in hand it was up to the surveyors to go out and collect precise location data for points visible in the photographs – things like road intersections, prominent terrain features or pre-positioned survey point targets.

APPS

APPS – the Analytical Photogrammetric Positioning System. The APPS permitted surveyors and terrain analysts to precisely determine points on the ground using georeferenced stereo images. The system consisted of a point positioning stereoscope hooked to an early HP desktop computer. Each set of stereo images came with a computer tape that held the ephemeris data for each image. The operator would pick a point on the image in stereo (road intersection, building roof, etc.), tap a foot switch and the computer would print out the point location in latitude and longitude. The APPS was often used by surveyors to collect photo control point coordinates without having to do a formal field survey. For its time this was a revolutionary system.


Survey1

Surveyors ‘turning angles’ with a conventional theodolite (probably a Wild T2). The instrument would be set up over a known control point and used to measure the precise angle to other control points. The operator would call out the angle readings and the Soldier standing behind with the notebook would record the readings and do quick checks of the angle measurements to ensure the readings were accurate.


Survey4

What are the surveyors in the previous photo aiming at? One of these, of course! This is a Wild survey target. It would get set up over a control point that is key to the survey. The theodolite operator adjusts the crosshairs in the theodolite telescope so they bisect the white ‘arms’ and ‘skirt’, of the target, then reads the angle of measurement.


Survey2

 If a theodolite measures angles how do we measure distances? Well in the 1970’s we used microwave distance measuring equipment called the Tellurometer. The system consisted of a master and a remote unit and measured the time it takes a reflected microwave signal to return the master unit, which was then converted into distance. While I don’t have any hands-on experience using these units, I do remember sitting in on several meetings at the 649th where the surveyors discussed what a headache they were to operate and maintain. By 1980’s standards this was old technology and the units the Army had adopted were becoming maintenance nightmares. But in their time these distance measuring units were a revolutionary time saver. Note the headset the soldier is using. He’s actually talking to the operator at the remote unit via a built-in radio link. The two operators had to continuously coordinate settings and monitor performance during the distance measurement operation.


Survey3

 Here is the back of the Tellurometer unit showing the instrument settings panel.


Calculator

This picture shows the only Soldier in this series that I’ve met. CW2 Thomas (on the right) is demonstrating a new Hewlett-Packard calculator to a visiting British Army officer. CW2 Thomas was one of several survey warrant officers assigned to the 649th. We met at Fort Bragg, North Carolina years after this photo was taken. The Hewlett-Packard (HP) calculator is interesting because they were widely adopted by surveyors due to their rugged construction and advanced functions that were well suited to surveying applications. While I don’t think any HP pocket calculator was ever officially adopted by the Army they were in wide use at the Defense Mapping School where our surveyors were trained. Many of the HP calculators found their way into survey units through local purchase by individual units.


 Photomapping

Photomapping is the process of compiling a topographic map based on information seen in the aerial photographs. Military topographic maps consisted of at least five distinct information layers, each with its own color – cultural features (black), water (blue), vegetation (green), contour lines (brown) and boundaries and built-up areas (red). It is the job of the cartographer to extract each of these information layers from the aerial photography to create a map manuscript. First the cartographers would rectify each aerial photo by removing any tip or tilt in the photo and tying it to the survey control points. Then they would use a device called a multiplex plotter to project the photos in 3D so the cartographer can trace out the key features while viewing the photos in stereo. Once the information is traced onto a manuscript sheet it is passed over to other cartographers who precisely trace out the collected information using the precise symbols we see on the finished map.

Carto3

This photo shows a cartographer setting up a multiplex plotter in preparation for tracing out a new map information layer using photomapping techniques. The multiplex plotter used a stereo pair of aerial photos to project a 3-dimensional image of the terrain onto the white disc or platen of the mutiplex tracing ‘table’ (the device with the white disc seen sitting on the table). The tracing table has a small tracing dot engraved on it that sits directly above a pen holder. The stereo images have been transferred to two small glass diapositive images, and in this picture you see the cartographer holding one of the diapositives in his left hand as he mounts it into the projection stage. The tall ‘can’ in his right hand is the projector assembly that contains the projection lamp, lens assembly and filter. One diapositive is filtered red, the other blue, and the operator wears a pair of glasses with one red and one blue lens (just like the old-time 3D movie glasses), enabling him to see the projected image in stereo.


multiplex plotter

Here we see a cartographer tracing data from the projected image onto a manuscript sheet (usually a sheet of dimensionally stable material like Mylar). You can see entire image projected onto the the table surface just under his forearm, but only the small area projected onto the multiplex table platen is in focus. Engraved on the center of the platen is a small tracing ‘dot’, and mounted directly below it is a tracing pencil. The cartographer carefully adjusts the platen up or down so the tracing dot appears to rest directly on the ground on the stereo image and he then begins to trace out features. He traces one layer type onto each sheet; one sheet for cultural features, one sheet for hydrology (water), one sheet for vegetation etc.


Cartographer

Once a manuscript map layer is drawn it is turned over to other cartographers who carefully trace out the data using approved map symbols and line types. This is called the compilation process, where the cartographers compile the data into standard formats. Map compilation is precise and exacting work, and a cartographer can spend days, sometimes weeks, working on a single sheet.


Carto2

Once each manuscript layer is complete it the information it holds is photographically ‘burned’ or transferred to specially coated plastic called either scribe coat or peel coat (seen above). The words ‘scribe’ and ‘peel’ describe the manner in which the orange coating (seen above) is removed to create clear windows through which a photographic negative can be exposed. Because of the unique nature of the orange coating it completely blocks all the light wavelengths that a film negative is sensitive to, so the orange areas come out black (or unexposed) when the negative is processed. Cartographers use specially designed scribing tools to carefully etch away the areas that represent point or linear features like individual buildings or roads. For larger areas like lakes or farm fields a sheet of peel coat is used, which allows large areas to be carefully cut with a sharp knife or razor blade and peeled away.


Carto4

All military maps have grids, and the grid on each map is unique based on the area of the world it covers. Calculating and drawing these grids requires great precision and accuracy since the grids must be exact or the grid coordinates a Soldier derives from an improperly gridded map could be hundreds or thousands of meters off. Here a cartographer is setting up an automated plotting device used to precisely draw the grid for a particular map sheet. Automated tools like this greatly reduced the human error often encountered when drawing grids and speeded up map compilation.


Map Reproduction

Once the cartographers completed the map compilation phase the manuscript sheets were turned over to the Reproduction Platoon for all the steps necessary to print the final map. This normally involved preparing negatives from the scribe and peel coat layers prepared by the Photomapping Platoon, editing and correcting the negatives, making press plates and finally, printing the map.

Layout3

To speed up the map compilation process cartographers made heavy use of pre-printed text. Things like standard place names (cities, towns, etc.), major feature names (rivers, mountains, etc.) and road identification symbols (highways, autobahns, etc.) would all be identified using standarized text that was prepared by the Reproduction Platoon. The cartographer would submit a list of feature names with text style and size requirements and the Reproduction Platoon personnel would provide the information on clear adhesive backed sheets that were created using a photo transfer process. Here we see a Soldier setting up some text as requested on the order sheet attached to the clipboard.


Layout1

One of the last steps in map production is making the negatives from which the press plates are produced. Here we see a Soldier from the Reproduction Platoon doing a final check of a negative before approving it for plate production.


Layout2

The final step before going to press is the plate making or ‘burning’. Press plates are just thin sheets of aluminum specifically sized to fit on a printing press. A map layer negative representing all features of the same color (black, blue, green, brown or red) is placed on top of a press plate that has been coated with a photo sensitive emulsion and the two are placed in a vacuum frame plate maker that uses a high intensity lamp to ‘burn’ or expose the positive image onto the plate. Once the plate is burned it is washed to remove the emulsion and the resulting image is what gets printed on the map. In this photo we see a Soldier from the Reproduction Platoon doing a final cleaning of a press plate before sending it on to the press section.


Press3

The 649th ran a number of presses of different size and capacity, everything from small trailer mounted presses capable of producing only 1:50,000 and 1:250,000 scale maps to large format presses permanently installed in the battalion’s base plant and capable of producing over-sized maps and other geographic products. In this picture we see a press operator from the Reproduction Platoon loading a press plate onto a van mounted Harris offset press.


Press2

Here’s a photo of one of the 649th’s presses installed in its baseplant at Tompkins Barracks in Schwetzingen.


Press1

Here’s a photo of the feeder end of another one of the 649th’s large format presses. In this photo it looks like already printed map sheets are being fed back through the press to add another information layer or military overprint.


Map Distro

The very last step in map production is actually map distribution. The 649th also had a Map Distribution Platoon that stocked and distributed the printed maps to units all across Europe. The platoon was responsible for getting the most current maps into the hands of the front line soldier as quickly as possible. The 649th maintained a map distribution warehouse at Tompkins Barracks and at several contingency sites around Europe. The platoon even had specially designed vans that were mobile distribution warehouses that could service forward deployed headquarters. Here we see Soldiers from the Map Distribution Platoon restocking maps at the distribution warehouse at Tompkins Barracks.


And there you have it, Army field map production circa 1970. As I mentioned in the start of this post I’ve taken a lot of liberties by overly simplifying the map making process with the intent of highlighting the Soldiers and activities of the 649th. If any readers recognize any of the Soldiers shown in these photos (or if you happen to be one of these Soldiers) I’d love to hear from you. You can either add a comment to this post or contact me at oldtopographer(at)gmail.com. If I’ve made any factual errors in the map making process, or if I’ve mis-identified any of the process shown in these photos please leave a comment here and I’ll make the necessary corrections. Thanks, and I hope you’ve enjoyed this trip down memory lane!

– Brian

Hey Kids, Let’s Order A Map!

The mailman dropped off something nostalgic a few days ago, an Army publication from the days when men were men, HMMWVs were new and the Army still ran IBM 360 mainframes.

That would be back around the end of the last ice age, or 1984 to be exact.

Need a map?  The Army Engineers came up with this nifty graphic training aid to guide you through the arcane process of ordering maps.

Now, map supply was no minor concern.  The Army had an almost insatiable appetite for paper maps, and in 1984 that demand was filled by the Defense Mapping Agency (DMA). The Defense Mapping Agency was a victim of its own success. They did such a good job of compiling, printing, distributing and updating their standard map products (which covered literally all of the world at one scale or another with the exception of the US and its territories – that job fell to the USGS), and they didn’t charge for their services. You could order all the maps you wanted and have them delivered for free.  Even better, if you set up an automatic distribution account the Defense Mapping Agency would automatically ship you any updated map sheets for your area of interest whenever they were published.

As a result maps became a commodity item, something everyone was used to having immediately available at any hour, day or night.

In reality, we had to order the darned things, and the ordering process could be pretty tricky.  Like many things in that great machine known as the Army supply system, if you filled all the paperwork out right you stood a 50/50 chance of getting what you ordered.  If you made even a slight mistake – say you accidentally put down an incorrect map sheet number – your requisition was routed straight to supply system purgatory, where it languished indefinitely while your installation logistics office returned the dreaded ‘BB’ (backordered) status month after month after month.

So let’s peel open GTA 5-2-14 and see what it has to say about ordering maps.


Yes sir, let’s put that funny shaped helmet that’s two sizes too small on our head and get to work.  Question – did the Army pubs system only hire third graders to do the illustrations for their training aids?  Anyway, we’ve got a big operation coming up.  The weather’s warming up and the Command Sergeant Major wants a briefing on the post spring cleanup plan. That’s as big and hazardous an operation as any I’ve ever encountered!

So the 5-2 has the map catalogs?  Oh sorry, that would be the S-2.  Didn’t anyone at the Engineer School take a look at this thing before giving the go-ahead to print and distribute hundreds of thousands of copies? Anyway, as a former battalion S-2 I can confirm that I had a complete set of DMA catalogs.  I kept them locked in the bottom drawer of my safe, along with a loaded pistol, in case a second lieutenant dropped by to try to teach him/herself the arcane art of ordering maps.  DMA map catalogs were simply too dangerous to leave unsecured.  Someone might do something dumb and I’d come to work one day to find pallets of maps sitting outside my office (remember, they’re free and DMA will ship as many and as often as you like).

Oh damn.  It’s about to get tricky…

The DMA map catalogs were hundreds and hundreds of pages of small scale maps covered in teeny-tiny squares, each with a unique number.  Each square represented an individual map, and you were expected to put on your reading glasses (or for the really cool intel types, pull the monocular magnifier out of the Photo Interpretation Kit) and start writing down the number for each and every map you need to order. Remember, no mistakes!

Got it?  It’s at about this point that the average second lieutenant’s eyes would glaze over…

This is where those in the know could have some fun.  See that Priority box?  If you wrote ‘3’ in there you’d get your maps pretty quick, but if you put a ‘1’ in there you’d start alarm bells ringing all around the Washington D.C.beltway as flag officers tried to figure out just why the 443rd Mess Kit Repair Battalion at FT Bragg needs 500 copies of every map of Western Europe by noon tomorrow.  What do they know that Washington doesn’t?  Maybe the 443rd is just a cover unit for Delta Force?  Yeah, that has to be it!

Flat or folded?  That’s like ‘boxers or briefs’.  It didn’t matter what you put in that box, you were getting folded maps.  Ever tried running a folded map through a Heidelberg offset press to print an operations overlay?  It didn’t work.  We tried everything short of holding the DMA director hostage at an undisclosed location in a strip club on 14th Street in Washington D.C. to get them to ship unfolded maps, to no avail.  I think DMA just did it out of spite.  Oh, and don’t forget to have an officer sign the requisition, because everybody knows only officers know what’s going on.  You gotta’ wonder how many requisitions were submitted with signatures that read “Mickey Mouse, 2LT, IN”.
Where indeed to send that requisition?  We’ll have a look at what the GTA says, then I’ll reveal the real secret to map supply!
Going to war in Europe?  Send your request to the 649th at Tompkins Barracks in Schwetzingen.  Judging by where the artist placed the star, Schwetzingen is located somewhere near the Polish/Czech border.

Going to war in Korea?  Send the request to the USFK Engineer office.  Going surfing Going to war in Hawaii?  Send your request to Hickam Field.

Planning to go to war in Central or South America?  Send your request to the DMA distribution office in Panama.  I actually have a soft spot in my heart for this office.  While stationed in Panama as part of the US Army South DCSINT I used their services a lot.  The map warehouse was run by the Air Force and those guys were great.  I’d call them from my office, tell them what I needed, hop in my HMMWV and drive up the road to Albrook Air Force Station and they’d have the maps sitting on the counter waiting for me.
Well kids, we’ve come to the end of our class on ordering maps the Army way.  This GTA makes it look easy, right?  We’ll listen close and I’ll tell you how map requisition really worked at places like FT Bragg, FT Campbell, FT Hood and other major installations…  you’d just drive over to the installation map warehouse and start banging your fist on the counter until the map distribution guys coughed up what you wanted.  It also helped if they were in your company and they worked for you.  I don’t think I used these ordering procedures more than once or twice in my whole career.
– Brian


Orientation – It’s Not Just For College Freshmen!

I came across another neat little Army publication the other day, one I’d never heard of before and initially thought it was an Army Corps of Engineers manual:

This little manual covers a lot of advanced topics such as geodesy, survey, coordinate determination, even astronomical observations using theodolites.  It’s a  pretty intensive manual, chock full of weighty Engineer topics.

Only it’s not an Engineer manual.  I was surprised and bemused to see that it was published in 1941 under the direction of the Chief of Coast Artillery.  Huh?  Coast Artillery?

So what did the Coast Artillery mean when they used the term ‘orientation’?

Definition – The term orientation as used in the Coast Artillery Corps means:
a. The accurate location of datum points and the establishment of ines of known length and direction.
b. The adjustment of the azimuth indicating devices on guns and observing instruments when the axis of the line of sigh is pointed at that azimuth.

Application – In its application to artillery, the term orientation includes the following:
a. The determination of the meridian for the measurement of azimuths.
b. The determination of the coordinates of the directing point, observing stations and spotting stations for a battery.
c. The determination of the length and azimuth of base lines and director offsets.
d. The establishment of such reference and datum points as may be necessary.     

(TM 4-225 Orientation, paragraph 2. a. & b.)

For those not aware, since the founding of our country right up until the mid-20th Century our key harbors and coastline sections have been overwatched by large artillery pieces, designed and situated to destroy enemy vessels intent on entering our harbors and waterways and doing damage.  In fact, one of the earliest jobs of the Corps of Engineers was the construction of harbor and waterway defenses and the siting and preparation of the firing positions for these coastal artillery guns.  However, it wasn’t until 1901 that the Army recognized the key differences between the missions of the coast artillery and field artillery by establishing the Coast Artillery Corps as a separate branch.

Modern field artillery has always had a strong need for surveyors.  As the concepts of indirect artillery fire matured and rifled cannon delivered the ability to fire projectiles far beyond the visual range of the gun crews the need for surveyors to accompany and support field artillery units emerged.  After all, to accurately hit a target you can’t see you first have to know precisely where you are.  Many of the concepts covered in this little manual are directly applicable to field artillery survey.  But we are talking about field artillery –  guns that get towed around the battlefield by trucks, set up, shoot some shells then pack up and move to the next firing position.  Coast Artillery is a different beast.  It operated large, permanently placed guns overlooking harbors and waterways that were already precisely mapped.  Why the need for more advanced surveying and mapping techniques?  The answer is laid out in Section (Chapter) IX of the manual, where it discusses the duties of the Battalion Reconnaissance Officer.

It appears that not all Coast Artillery cannon were permanently mounted.  At the time of publication the Coast Artillery Branch either had or was anticipating use of mobile 155-mm artillery, railway artillery and anti-aircraft guns.  It would be the responsibility of the Reconnaissance Officer and his reconnaissance parties to find new gun locations, work out their proper positioning (orientation) and if necessary map the the new areas of coverage so the gunners knew where they were shooting.

The battery reconnaissance officers, under the supervision of their battery commanders, compute the data necessary for the orientation of the plotting boards and complete the organization of the battery plotting rooms and observing stations.  The battery executives, utilizing the orienting lines supplied them, orient the guns of their batteries.

(TM 4-225, paragraph 49. e.)

While coastal defense was a huge mission during WWII, and the Coast Artillery branch provided a key service to the nation, it quickly became apparent that aircraft were a far more effective coastal defense tool than land-based artillery.  By the end of the war long range bombers and radar made fixed coastal defense sites obsolete. In 1950 the US Army dissolved the Coast Artillery branch and absorbed its officers and enlisted personnel into the regular Field Artillery branch. Today all that remains of a once proud branch of the US Army are some abandoned casements dotted along the Atlantic and Pacific coasts, and at the Presidio of San Francisco you can still view an original ‘disappearing’ coastal defense gun at Battery Chamberlin.

Battery Chamberlin
The Presidio of San Francisco

Brian

History Revealed! Origins Of The Army Lensatic Compass

For several years I’ve been trying to piece together the history of the US Army’s lensatic compass.  In an earlier post on this blog we discussed the various types of compasses and a bit of the developmental history that can be inferred by viewing the examples in my collection.  However, there was (and still is) very little solid history on the development of the lensatic compass available on the web.

For an item as ubiquitous as this compass the lack of historical data seems a odd.  The development and usage histories of many other items of WWII-era equipment are well documented.  Take the M1 Garand for example.  Collectors can discuss in detail every single part on that rifle and can accurately date and discern the manufacturer of each part by noting subtle differences in how the piece was machined or finished.  This wealth of knowledge is due to the fact that the development and production records for the Garand were made available decades ago by the US military and the various manufacturers.  Of course collector interest is also a factor.  The Garand is one of the most collected pieces of WWII equipment and when you have thousands of collectors clamoring for detailed information the odds are pretty good someone is going to unearth the data.  Since there can’t be more than a dozen serious collectors of Army lensatic compasses there’s a whole lot less clamoring.

As an item of individual equipment that guided millions of Soldiers across the battlefields of Europe and the Pacific in WWII, and continues in use by our Soldiers today, I’ve always felt the history of the lensatic compass deserved better coverage.

Earlier this week I was on a different quest.  I recently purchased an interesting bit of Army topographic kit, a Vertical Sketchmaster (I’ll do a posting on that later).  Since the device came without paperwork or documentation the first thing I did was hit Google for a quick search.

[A short segue here.  Hey Google, your search results are starting to look like those from the half dozen or so search engines that have all but fallen off the internet.  When I do a search on your site I’m looking for real results, not page after page of ads or eBay listings.  Any more, searching on Google is like searching on – dare I say it – Yahoo!]

Buried about three pages deep in the search results was a reference to a holding in the Defense Technical Information Center (DTIC) titled “History of [the] U.S. Army Topographic Laboratories (1920 to 1973)”.

The phrase “Army Engineer Topographic Laboratories” got my immediate attention because the document could only be referring to what used to be know as the Army Corps of Engineers’ Engineer Topographic Laboratories, or ETL.  ETL and it’s predecessor organizations within the Corps of Engineers served (and still serve) as the Army’s R&D lab for development of topographic, terrain analysis and geospatial systems, processes and equipment.  Now called the Army Geospatial Center, it was an organization I called on many times during my career for support and advice, and they always came through.

As luck would have it the document is available in digital form through Google.  I immediately downloaded it and started reading.  Published in 1973 as an ETL internal paper by John Pennington, it is a short rundown of the history of the Army’s topographic R&D labs and covers major projects and equipment development between 1920 and 1970.  I don’t want to spend too much time on this document in this post, because I feel it deserves it’s own separate discussion at a later date.  For now I’ll just say it is a treasure trove of historical information.

While reviewing the document for information on the vertical sketchmaster I quickly came across discussion of lensatic compasses.  This was something completely unexpected.  I never considered that the development of the lensatic compass was something an Engineer topographic R&D lab would have been involved with.  After reading the entries it now makes perfect sense – the Engineers had doctrinal responsibility for development of land navigation equipment and were the Army’s subject matter experts on compasses of all types.  While the development of land navigation techniques including the use of map and compass was the responsibility of the Infantry School, development of the compass as an item of equipment was the responsibility of the Engineers.  Of course the two branches worked hand-in-hand on the project, with the Engineers serving as a test and development agency in support of the Infantry School.

The document briefly discusses compass development both prior to and after WWII and adds some fascinating tidbits to the history of the development the lensatic compass:

Since the quality of the scan is pretty poor I’ve reproduced the key parts below:

(7)  Compasses.  Although the compass is not strictly a surveying instrument, considerable effort was expended by the Mapping Branch of the Engineer Board in the World War II period on the development of small compasses for Infantry and other arms.


The work started in 1938 when the Infantry requested that an inexpensive, commercial-type compass be found to replace the marching compass then issued because the marching compass was too large, elaborate, and costly.  This investigation was assigned to the Engineer Board, and it was soon found that no suitable commercial compass was available.  The W. & L.E. Gurley and the Taylor Instrument Companies, however, were willing to make a suitable compass based on a new design; and each company made six samples in 1939 as ordered from the Engineer Board.


After testing by both the Infantry and Cavalry and some modifications by the manufacturers, in November 1940 the Engineer Board recommended procurement of the cheap lensatic compass from both manufacturers.”


Thus we have the WWII-era M1938 lensatic compass.

M1938 Lensatic Compass
My question now is, was this originally a liquid filled model?  Read below.

One interesting point is that while lensatic compasses made by Gurley are fairly common (they were a major manufacturer of surveying equipment at the time) I have never seen a military lensatic compass made by Taylor Instruments.  However, Taylor Instruments did go on to be a major manufacturer of wrist compasses for the US military in WWII.

But the story is not over.  Even back in 1940 they were struggling with the issue of how to dampen the compass needle or card.

“Since the mechanical dampening arrangements in all compasses available up to that time had not been entirely satisfactory, the Engineer Board started investigations of liquid dampening in December 1941.  Compasses of both the lensatic and the wrist type with liquid dampening were developed, tested, and adopted in the 1941 to 1944 period; and it was thought for a time that the compass problem had been solved.  However, it was discovered that, with temperature changes, an air bubble often developed in the compass capsule which impeded the free movement of the compass needle and affected the accuracy.


In July 1944, the Superior Magneto Corporation, one of the liquid-filled compass suppliers, solved the liquid  dampening problem by applying the induction dampening principle.  The compass body was made of copper which set up an eddy current and magnetic field as the compass needle rotated, thus acting as a drag to dampen the needle oscillation.  Samples were immediately procured and tested.  As a result, the induction dampened wrist compass was standardized in April 1945, and the induction dampened lensatic compass was standardized in May 1945.”


Based on the number of WWII compasses available for sale from auction sites like eBay I think that Superior Magneto was the #1 supplier of lensatic compasses during WWII.  Knowing their core business – the production of magnetos – it makes sense that their engineers would have a clear understanding of the principle of induction and how to apply it to the problem of compass needle dampening.

Today M1938 compasses with induction dampening are easy to identify.  They have a white compass bowl that contains the compass card.  The white bowl is the stamped copper cup that the compass magnet interacts with to slow oscillation.  It is an excellent dampening system and is still used today in US military-issue lensatic compasses.

M1938 Lensatic Compass with induction dampening.
Note the white compass bowl.  This is really a stamped copper cup that interacts
with the north-seeking magnet to reduce oscillation of the compass card.

Let’s skip forward now to the late 1940s, when it was clear that the lensatic compass was in need of an upgrade.

(3)  Compasses.  The development of compasses, both the wrist and the lensatic types, was reopened in 1947 to provide instruments which would overcome the deficiencies noted in those developed during World War II.  Experimental models of the lensatic compass were produced by Taylor Instrument Company, Rochester, New York (Fig. 84), and the Brunson Instrument Company, Kansas City, Missouri.  Both were found to conform to the military characteristics, but the Brunson model was considered superior.  Experimental models of the wrist compass were produced by the Brunson Instrument Company, Kansas City, Missouri (Fig. 85), and were delivered to ERDL in January 1950.  Cold weather tests of the lensatic compass were conducted at Fort Churchill, Canada, and in January 1951 service test models were procured and shipped to service test agencies.  Here again, as with the compass development during World War II, emergency procurement of large quantities of both compasses were made before all testing and development had been completed.


Development of both compasses was completed in 1952.  The lensatic compass was classified as standard type, and the project was closed in November 1952.”


The result of these tests and type classification are the classic M1950 Lensatic Compass, a design still in use today:

M1950 Lensatic Compass produced in 2010 by Cammenga.
Today Cammenga is the sole contractor producing lensatic compasses
for the US military.

The M1950 is still one of the best compasses ever developed, and I consider it the best military compass ever issued to any military anywhere in the world.