I was going through some photos in my collection for some Facebook friends and ran across a collection of old shots I acquired while assigned to the 320th Engineer Company (Topographic) back in the late 1990s. I say ‘acquired’ because I just happened to find them lying around my office as part of some left over historical records from the old 649th Engineer Battalion (Topographic). All are 1970’s vintage photos that highlight the map making activities of the 649th. The 649th provided comprehensive topographic support – survey, map production & distribution, terrain analysis, and geographic intelligence analysis – to US Army Europe (USAREUR).
In the early 1980’s I was assigned to the 649th at Tompkins Barracks in Schwetizingen, Germany. I served as the commander of one of the terrain analysis detachments. I have a lot of good (and some not-so-good) memories of the 649th and the Soldiers that served in the unit. Fifteen years later I found myself back in Germany. By then the 649th had been deactivated and my unit, the 320th Engineer Company (Topographic), was the last surviving remnant of the 649th. The 320th had received a lot of left over equipment and paperwork from the 649th and one of my duties was to sort through it all to determine what was worth keeping and what could be trashed. During this process I found the photos you see in this post.
All of these photos were rejects, shots the photo editor didn’t think were worthy of using in a presentation. That accounts for a lot of the grease pencil ‘mark outs’ you see on many of the images. The interesting part is that the pictures that made it past the editor and into various publications or presentations are long gone – either packed up with the unit’s archives and locked away in an Army records warehouse or tossed into a trash can. Only the rejects survived to make it to my desk long after the battalion inactivated.
The 649th rarely made a new map from scratch. Most of the work involved updating existing maps or creating specialized overlays (like military operational graphics) to be overprinted onto existing maps. Still, the battalion had all the functional components necessary to create a new map:
- Topographic and geodetic survey
- Photomapping and cartography
- Layout, photolithography and printing press operations
To accomplish these tasks each topographic company within the 649th was divided into three platoons – the Survey Platoon (topographic & geodetic survey), the Photomapping Platoon (photo control, compilation and drafting) and the Reproduction Platoon (layout, photolithography and press).
So let’s take a look at these processes as practiced by Soldiers of the 649th. This isn’t intended to be a comprehensive overview of map making; there are some large gaps in this tale simply because I don’t have any photos depicting specific steps. The real goal here is to highlight the Soldiers and their activities.
Survey
Each map starts with two things – stereo aerial photography and a topographic survey to ‘tie’ the photos to their location on the face of the earth. Army topographic units relied on US Air Force photomapping squadrons to provide the aerial photography. Once the topographic unit got the aerial photography in hand it was up to the surveyors to go out and collect precise location data for points visible in the photographs – things like road intersections, prominent terrain features or pre-positioned survey point targets.
APPS – the Analytical Photogrammetric Positioning System. The APPS permitted surveyors and terrain analysts to precisely determine points on the ground using georeferenced stereo images. The system consisted of a point positioning stereoscope hooked to an early HP desktop computer. Each set of stereo images came with a computer tape that held the ephemeris data for each image. The operator would pick a point on the image in stereo (road intersection, building roof, etc.), tap a foot switch and the computer would print out the point location in latitude and longitude. The APPS was often used by surveyors to collect photo control point coordinates without having to do a formal field survey. For its time this was a revolutionary system.

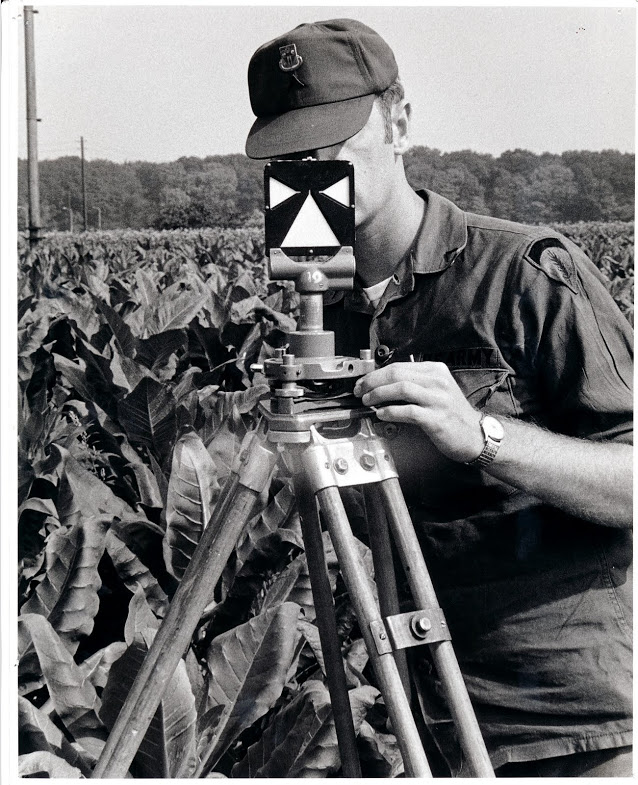
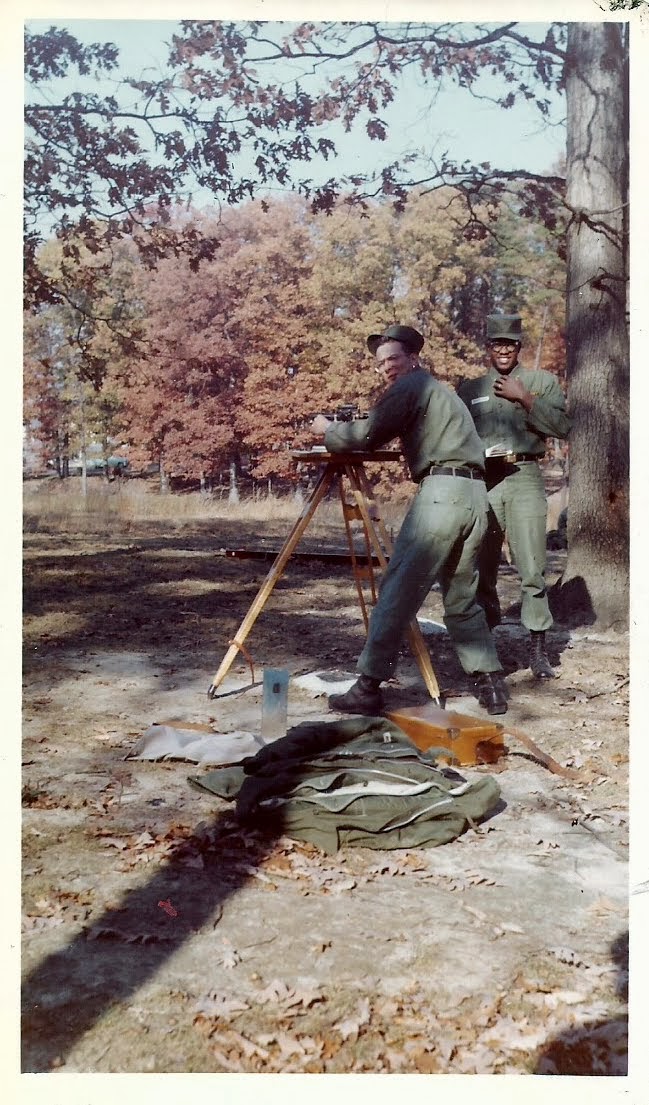
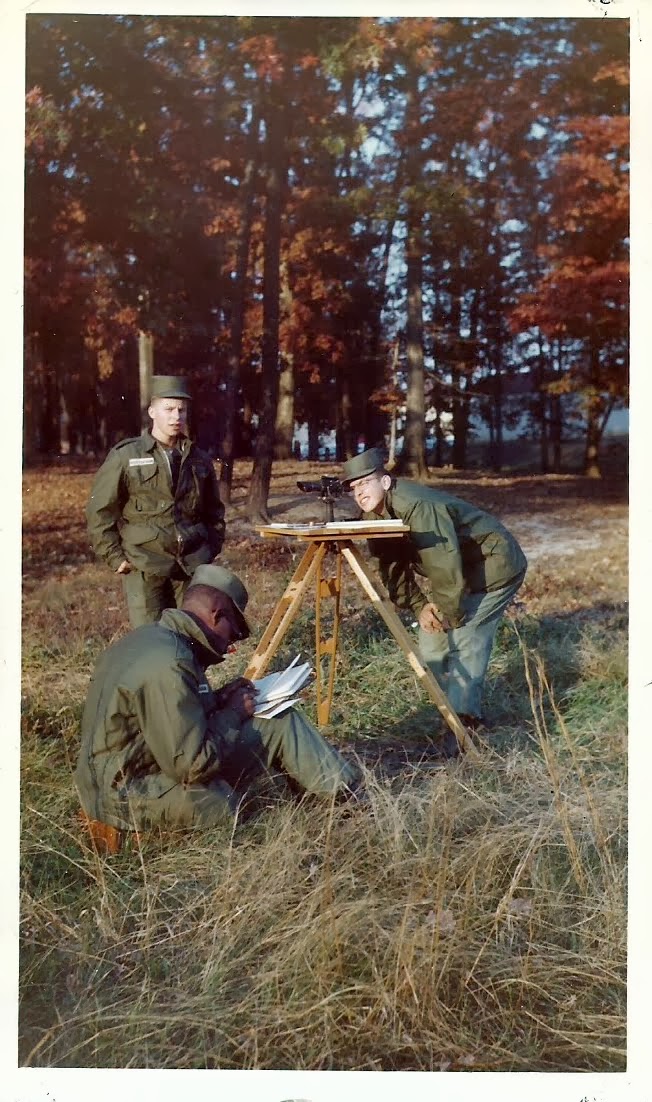
Surveyors ‘turning angles’ with a conventional theodolite (probably a Wild T2). The instrument would be set up over a known control point and used to measure the precise angle to other control points. The operator would call out the angle readings and the Soldier standing behind with the notebook would record the readings and do quick checks of the angle measurements to ensure the readings were accurate.

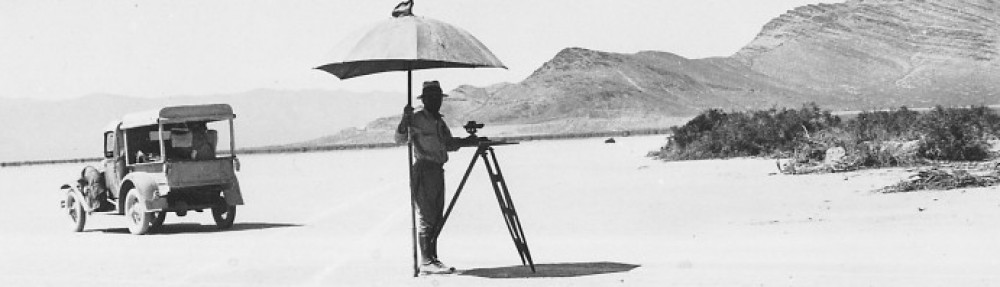
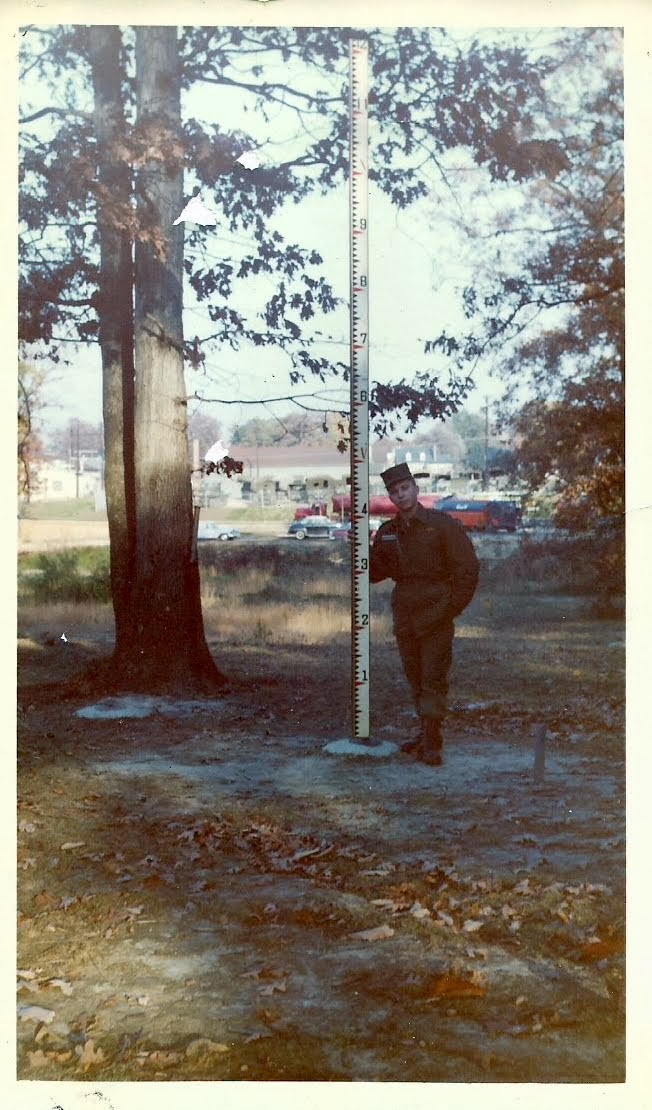
What are the surveyors in the previous photo aiming at? One of these, of course! This is a Wild survey target. It would get set up over a control point that is key to the survey. The theodolite operator adjusts the crosshairs in the theodolite telescope so they bisect the white ‘arms’ and ‘skirt’, of the target, then reads the angle of measurement.

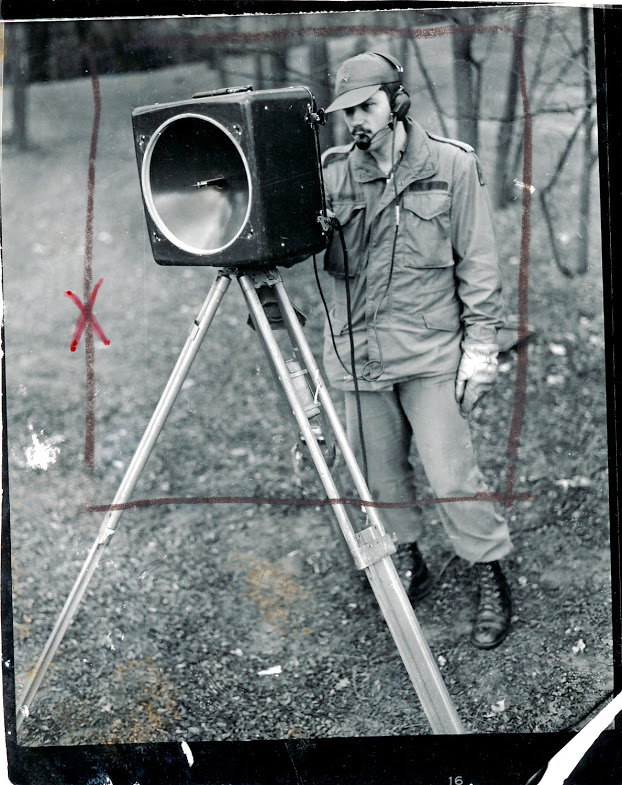
If a theodolite measures angles how do we measure distances? Well in the 1970’s we used microwave distance measuring equipment called the Tellurometer. The system consisted of a master and a remote unit and measured the time it takes a reflected microwave signal to return the master unit, which was then converted into distance. While I don’t have any hands-on experience using these units, I do remember sitting in on several meetings at the 649th where the surveyors discussed what a headache they were to operate and maintain. By 1980’s standards this was old technology and the units the Army had adopted were becoming maintenance nightmares. But in their time these distance measuring units were a revolutionary time saver. Note the headset the soldier is using. He’s actually talking to the operator at the remote unit via a built-in radio link. The two operators had to continuously coordinate settings and monitor performance during the distance measurement operation.

Here is the back of the Tellurometer unit showing the instrument settings panel.

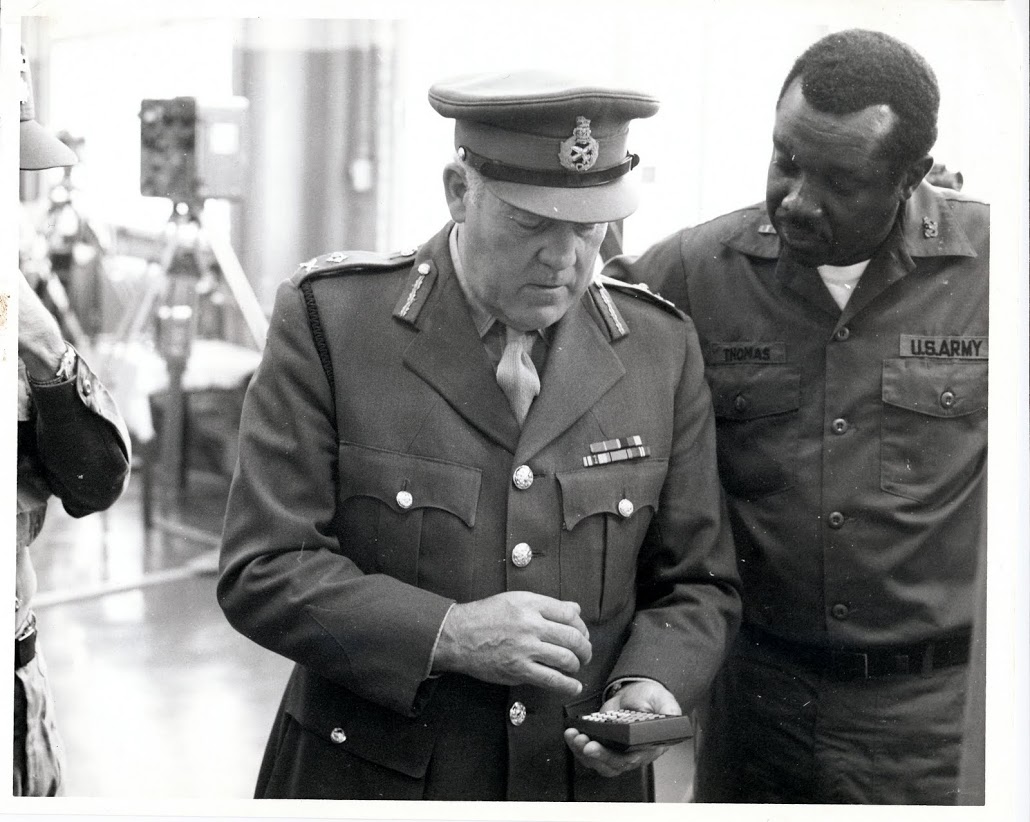
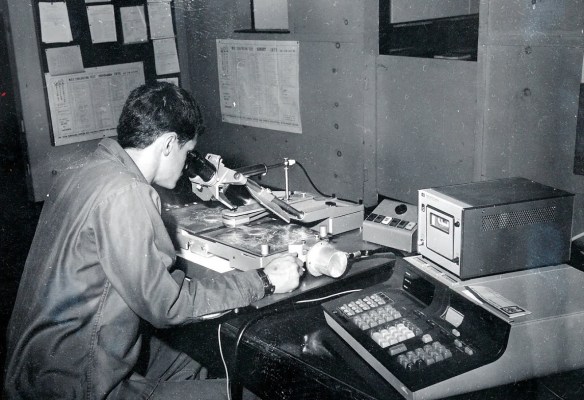
This picture shows the only Soldier in this series that I’ve met. CW2 Thomas (on the right) is demonstrating a new Hewlett-Packard calculator to a visiting British Army officer. CW2 Thomas was one of several survey warrant officers assigned to the 649th. We met at Fort Bragg, North Carolina years after this photo was taken. The Hewlett-Packard (HP) calculator is interesting because they were widely adopted by surveyors due to their rugged construction and advanced functions that were well suited to surveying applications. While I don’t think any HP pocket calculator was ever officially adopted by the Army they were in wide use at the Defense Mapping School where our surveyors were trained. Many of the HP calculators found their way into survey units through local purchase by individual units.
Photomapping
Photomapping is the process of compiling a topographic map based on information seen in the aerial photographs. Military topographic maps consisted of at least five distinct information layers, each with its own color – cultural features (black), water (blue), vegetation (green), contour lines (brown) and boundaries and built-up areas (red). It is the job of the cartographer to extract each of these information layers from the aerial photography to create a map manuscript. First the cartographers would rectify each aerial photo by removing any tip or tilt in the photo and tying it to the survey control points. Then they would use a device called a multiplex plotter to project the photos in 3D so the cartographer can trace out the key features while viewing the photos in stereo. Once the information is traced onto a manuscript sheet it is passed over to other cartographers who precisely trace out the collected information using the precise symbols we see on the finished map.

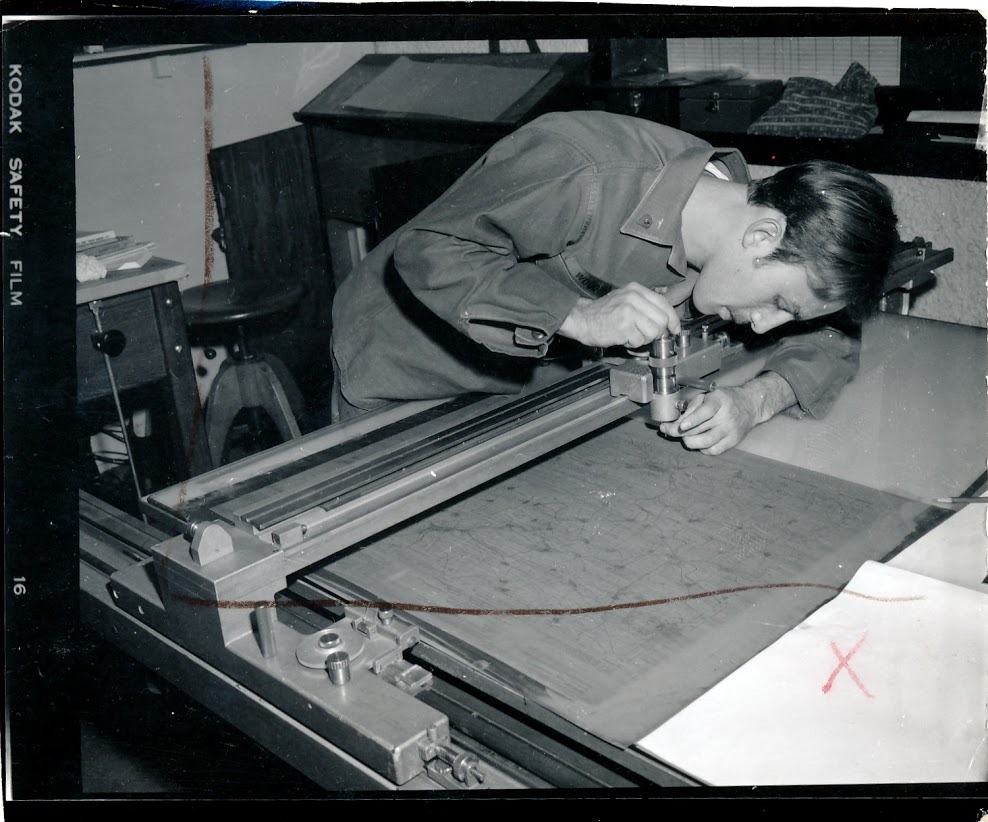
This photo shows a cartographer setting up a multiplex plotter in preparation for tracing out a new map information layer using photomapping techniques. The multiplex plotter used a stereo pair of aerial photos to project a 3-dimensional image of the terrain onto the white disc or platen of the mutiplex tracing ‘table’ (the device with the white disc seen sitting on the table). The tracing table has a small tracing dot engraved on it that sits directly above a pen holder. The stereo images have been transferred to two small glass diapositive images, and in this picture you see the cartographer holding one of the diapositives in his left hand as he mounts it into the projection stage. The tall ‘can’ in his right hand is the projector assembly that contains the projection lamp, lens assembly and filter. One diapositive is filtered red, the other blue, and the operator wears a pair of glasses with one red and one blue lens (just like the old-time 3D movie glasses), enabling him to see the projected image in stereo.

Here we see a cartographer tracing data from the projected image onto a manuscript sheet (usually a sheet of dimensionally stable material like Mylar). You can see entire image projected onto the the table surface just under his forearm, but only the small area projected onto the multiplex table platen is in focus. Engraved on the center of the platen is a small tracing ‘dot’, and mounted directly below it is a tracing pencil. The cartographer carefully adjusts the platen up or down so the tracing dot appears to rest directly on the ground on the stereo image and he then begins to trace out features. He traces one layer type onto each sheet; one sheet for cultural features, one sheet for hydrology (water), one sheet for vegetation etc.

Once a manuscript map layer is drawn it is turned over to other cartographers who carefully trace out the data using approved map symbols and line types. This is called the compilation process, where the cartographers compile the data into standard formats. Map compilation is precise and exacting work, and a cartographer can spend days, sometimes weeks, working on a single sheet.

Once each manuscript layer is complete it the information it holds is photographically ‘burned’ or transferred to specially coated plastic called either scribe coat or peel coat (seen above). The words ‘scribe’ and ‘peel’ describe the manner in which the orange coating (seen above) is removed to create clear windows through which a photographic negative can be exposed. Because of the unique nature of the orange coating it completely blocks all the light wavelengths that a film negative is sensitive to, so the orange areas come out black (or unexposed) when the negative is processed. Cartographers use specially designed scribing tools to carefully etch away the areas that represent point or linear features like individual buildings or roads. For larger areas like lakes or farm fields a sheet of peel coat is used, which allows large areas to be carefully cut with a sharp knife or razor blade and peeled away.

All military maps have grids, and the grid on each map is unique based on the area of the world it covers. Calculating and drawing these grids requires great precision and accuracy since the grids must be exact or the grid coordinates a Soldier derives from an improperly gridded map could be hundreds or thousands of meters off. Here a cartographer is setting up an automated plotting device used to precisely draw the grid for a particular map sheet. Automated tools like this greatly reduced the human error often encountered when drawing grids and speeded up map compilation.
Map Reproduction
Once the cartographers completed the map compilation phase the manuscript sheets were turned over to the Reproduction Platoon for all the steps necessary to print the final map. This normally involved preparing negatives from the scribe and peel coat layers prepared by the Photomapping Platoon, editing and correcting the negatives, making press plates and finally, printing the map.

To speed up the map compilation process cartographers made heavy use of pre-printed text. Things like standard place names (cities, towns, etc.), major feature names (rivers, mountains, etc.) and road identification symbols (highways, autobahns, etc.) would all be identified using standarized text that was prepared by the Reproduction Platoon. The cartographer would submit a list of feature names with text style and size requirements and the Reproduction Platoon personnel would provide the information on clear adhesive backed sheets that were created using a photo transfer process. Here we see a Soldier setting up some text as requested on the order sheet attached to the clipboard.

One of the last steps in map production is making the negatives from which the press plates are produced. Here we see a Soldier from the Reproduction Platoon doing a final check of a negative before approving it for plate production.

The final step before going to press is the plate making or ‘burning’. Press plates are just thin sheets of aluminum specifically sized to fit on a printing press. A map layer negative representing all features of the same color (black, blue, green, brown or red) is placed on top of a press plate that has been coated with a photo sensitive emulsion and the two are placed in a vacuum frame plate maker that uses a high intensity lamp to ‘burn’ or expose the positive image onto the plate. Once the plate is burned it is washed to remove the emulsion and the resulting image is what gets printed on the map. In this photo we see a Soldier from the Reproduction Platoon doing a final cleaning of a press plate before sending it on to the press section.

The 649th ran a number of presses of different size and capacity, everything from small trailer mounted presses capable of producing only 1:50,000 and 1:250,000 scale maps to large format presses permanently installed in the battalion’s base plant and capable of producing over-sized maps and other geographic products. In this picture we see a press operator from the Reproduction Platoon loading a press plate onto a van mounted Harris offset press.

Here’s a photo of one of the 649th’s presses installed in its baseplant at Tompkins Barracks in Schwetzingen.

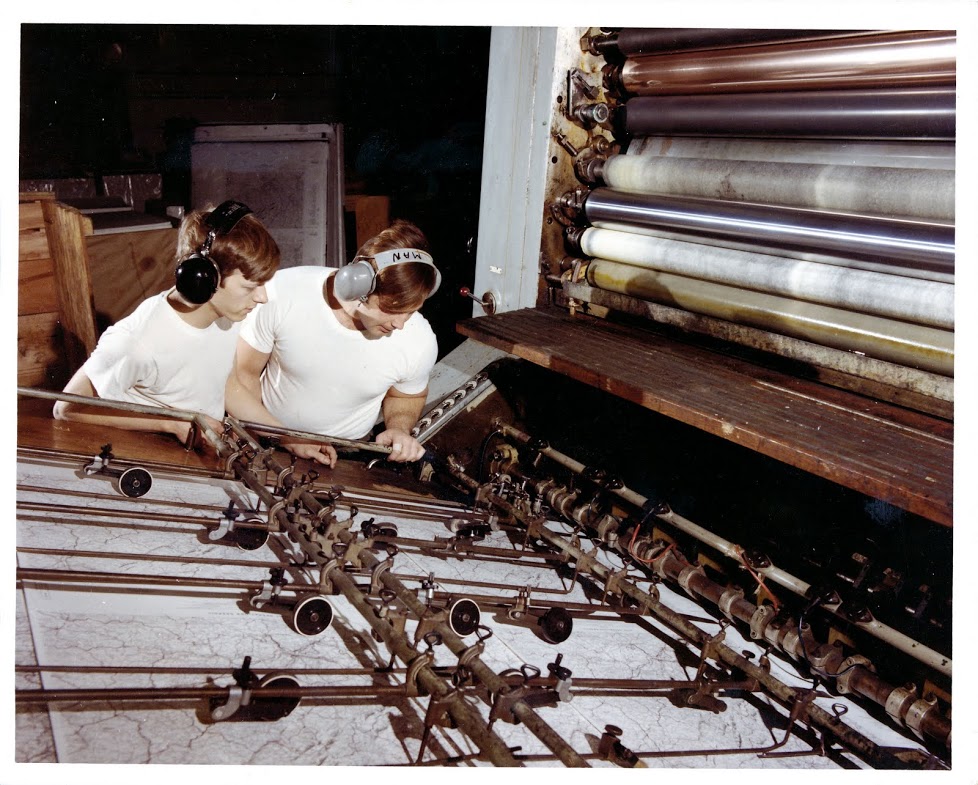
Here’s a photo of the feeder end of another one of the 649th’s large format presses. In this photo it looks like already printed map sheets are being fed back through the press to add another information layer or military overprint.

The very last step in map production is actually map distribution. The 649th also had a Map Distribution Platoon that stocked and distributed the printed maps to units all across Europe. The platoon was responsible for getting the most current maps into the hands of the front line soldier as quickly as possible. The 649th maintained a map distribution warehouse at Tompkins Barracks and at several contingency sites around Europe. The platoon even had specially designed vans that were mobile distribution warehouses that could service forward deployed headquarters. Here we see Soldiers from the Map Distribution Platoon restocking maps at the distribution warehouse at Tompkins Barracks.
And there you have it, Army field map production circa 1970. As I mentioned in the start of this post I’ve taken a lot of liberties by overly simplifying the map making process with the intent of highlighting the Soldiers and activities of the 649th. If any readers recognize any of the Soldiers shown in these photos (or if you happen to be one of these Soldiers) I’d love to hear from you. You can either add a comment to this post or contact me at oldtopographer(at)gmail.com. If I’ve made any factual errors in the map making process, or if I’ve mis-identified any of the process shown in these photos please leave a comment here and I’ll make the necessary corrections. Thanks, and I hope you’ve enjoyed this trip down memory lane!
– Brian