USGS TopoView

It’s rare that I publish blog posts back-to-back, but this new tool from the USGS is so impressive that it deserves to be showcased as soon as possible. I was chasing a link on the USGS site that was provided by a colleague in relation to my blog post yesterday on the Perrysburg Plat Map when I stumbled on a new product titled the USGS TopoView, or ‘topoView’ (note the lowercase ‘t’) depending on where you look on the site. We’ll use the more grammatically correct TopoView.

I’m not sure if this is a replacement for the USGS Historical Topographic Map Explorer released just last year or if it’s a complimentary app. The Historical Topographic Map Explorer seems more suited to map visualization on desktop systems while the TopoView app appears to be more of a data access tool, and one that is designed to run on mobile devices (although I haven’t tested it on a tablet – yet). The site runs slow so I’m guessing they have it running on a development server while they tweak the application, but when it runs well it’s a fascinating way to find, explore and even download USGS products.

I dare say, this is one web application that might just force me to go buy a plotter so I can print out my own full-scale historical map sheets.

So let’s cut to the chase. First watch this video:

Next, go play. Just click the image below to launch TopoView. And don’t blame me if your boss gripes about all the time you are spending on the computer.

USGS TopoView

Have fun!

– Brian

A Wonderful Way To Waste A Day

Yesterday on Facebook an old friend, Kurt Schwoppe, provided a link to a new US Geological Survey – ESRI joint project, the USGS Historical Topographic Map Explorer. At first I thought, “Meh, I think I’ve seen this before” and was about to move on, but something told me to click the link.

When I came up for air about a half hour later I was entranced. The USGS and ESRI have done a marvelous job of integrating historical map coverage with modern web map technology. The USGS has digitized and georeferenced their entire collection of historical toographic maps covering the entire country (about 178,000 individual maps). The coverage in many areas goes back to the late 1800’s, and users can easily select maps by date and scale, overlay them, adjust visibility to ‘blend’ the views and even download the historical maps directly from the interface.

USGS Historical Map Viewer

By default the website opens focused on New Orleans, as good a place as any to begin exploring the historical maps of a city. Clicking the map links in the timeline in the bottom window will add them to the ‘stack’ on the left side of the web page. From there you can adjust the visibility of each map using a convenient slider to blend the map image in and out, allowing fast and easy comparison with any of the other maps in the stack.

A few initial observations –

First, while there was a steady increase in both the density of content and the variety of information contained in maps as the USGS progressed through the 20th century, there was, sadly, a steady erosion in the practice of cartography as an artistic medium. I understand the USGS’s job isn’t to make art, but visual appeal is something that draws the user to the map. The hand drawn cartography applied to the USGS maps of the late 19th and early 20th century is a wonder to behold. By comparison the current US Topo series maps have all the visual appeal of a rusted out Yugo.

Next, there’s a clear improvement in the spatial accuracy and information content between maps prepared in the late 19th and early 20th centuries and maps prepared in the 1930’s and later. This is due to the adoption of aerial photography and stereo compilation production methods starting in the 1930s. By using stereo aerial photography as a map compilation base the USGS dramatically speeded up map production while simultaneously improving map accuracy and content.

To sum it all up I’ll just say that the USGS Historical Topographic Map Explorer website is the best use of my tax dollars that I’ve seen in a long, long time!

– Brian


Topographic Instructions of the US Geological Survey

How do you make a map? More precisely, how does one produce a map compiled to specific standards for accuracy, content and style? Does that question keep you up at night? Nah, me either. But it is an interesting question and I’d bet that if you put it to 100 people you’d get 110 answers.

Of course today it’s easy. Nobody really makes a map these days. Most just go to Google Maps on their smartphone or tablet, and these days that’s about all the ‘map’ most people want or need.

But 100 years ago things were much different. Back then there were still vast unmapped areas of the US and it was the responsibility of the US Geological Survey (USGS) to send topographic parties in to map them. This was before the era of cell phones, internet, GPS and even radio communications. Checking with the home office involved the US Mail or, if they were lucky, telegraph. For that reason these parties operated autonomously under the direction of a Party Chief. The Party Chief was part military general, part football coach and part college professor; he ruled with an iron fist and made sure everything was run properly, was responsible for the motivation and morale of his party and was the brains of the outfit. The Party Chief was vested with enormous authority because he had an enormous responsibility – he answered to his regional Chief Geographer for the accuracy and quality of his party’s work.

In 1913 Party Chiefs didn’t go about their work blind. They operated under a very detailed set of instructions and standards laid out in a USGS publication titled Topographic Instructions of the United States Geological Survey.

Topographic Instructions of the USGS

I find this a fascinating manual because it is the only publication I’ve seen that lays out in detail the steps necessary to create a map from scratch. It covers all the processes involved in creating a map to very specific accuracy, content and composition standards. This is, quite literally, the document that defined what we know today as the standard USGS topo quad sheet. Of course the USGS was producing standard topo sheets before this manual was published, but indications are that prior to 1912 the instructions were covered in separate publications and broken out by discipline. This manual brought it all together in a single reference that is remarkably clear and concise for its time, stripped of a lot of the superfluous language that Edwardian-era government functionaries were so fond of using. This is a manual designed to be used in the field by men who have a job to do.

The topics covered include

  • primary and secondary triangulation
  • primary and precise leveling
  • plane table surveying
  • map construction (compilation), drafting and editing
  • instrument care and repair

But beyond the technical, Topographic Instructions of the United States Geological Survey covers detailed administrative instructions to Party Chiefs on topics like crew selection, first aid for pack animals and crew members, how much food to pack, how many fountain pens to bring along, how to set up a base camp, even how to interact with local officials and the press.

It’s a soup-to-nuts manual on how to make a map from scratch.

– Brian

The US National Map

Earlier this month the US Geological Survey (USGS) released their latest version of The National Map Viewer.
US National Map View of Maumee, Ohio
The same view of Maumee, Ohio with the aerial image
background turned on

The US National Map is not a map per se.  You can’t ring up the USGS and say “Send me a copy of the National Map.”  It doesn’t exist as a single product.  The US National Map is a collection of digital geographic and geospatial data that, when brought together, forms the foundational map of the United States.  Here’s how the USGS describes it:

“As one of the cornerstones of the U.S. Geological Survey’s (USGS) National Geospatial Program, The National Map is a collaborative effort among the USGS and other Federal, State, and local partners to improve and deliver topographic information for the Nation. It has many uses ranging from recreation to scientific analysis to emergency response. The National Map is easily accessible for display on the Web, as products and services, and as downloadable data. The geographic information available from The National Mapincludes orthoimagery (aerial photographs), elevation, geographic names, hydrography, boundaries, transportation, structures, and land cover. Other types of geographic information can be added within the viewer or brought in with The National Map data into a Geographic Information System to create specific types of maps or map views. The National Map is a significant contribution to the National Spatial Data Infrastructure (NSDI) and currently is being transformed to better serve the geospatial community by providing high quality, integrated geospatial data and improved products and services including new generation digital topographic maps.”


OK, like I said, it’s a collection of digital geographic and geospatial data that forms the foundational map of the US.  Geeze, I think government bureaucrats get paid by the word.

Here is the USGS’s introduction to the National Map program and the National Map Viewer:

The National Map Viewer is the USGS’s on-line portal to all the data that makes up the National Map.

The Viewer is pretty good (if you are at all interested, it is built on ESRI’s ArcGIS Server technology) and offers some neat functionality.  It will provide location information in a number of formats, including US National Grid coordinates, it has a pretty robust reverse geocoding feature (click on a building on the map and the map returns the street address for that location) and it will provide spot elevations from the national elevation dataset.  You can do area and distance measurements, add text and simple graphics and even add data from external sources like a GoogleEarth KML file or a web mapping service.  You can also bring up indexes for the USGS’s standard map products like the US Topo series of maps and link to them for download as GeoPDF files.  For advanced users the Viewer offers some pretty good search and query builder functionality, so you can find specific data that is embedded in the data layers.

There are some shortcomings, however.  The print function is essentially useless and is perhaps THE major drawback of this Viewer.  About all it does is grab a screen shot of your viewer and dumps it to a PDF file.  The USGS needs to wake up and realize that people still want quality paper maps and with today’s technology it should be easy to print a fully detailed paper map with things like a grid, scale indicator, geographic extents, legend, etc.

The Viewer also exhibits a common issue found in web-based maps – map content naming conventions can be pretty obtuse and downright confusing.  While the Viewer does pretty good with the base data layer naming conventions, when you start using advanced features like the Query Builder you start to interact directly with the database field names.  For example, if I’m building a query to identify all the wetlands in my county I’m presented with a list of ‘Columns’ (which are the database field names).  Those column names are confusing and don’t mean anything to most humans.  We get to pick from selections named ‘ATTRIBUTE’ or ‘OBJECTID’ or ‘SHAPE_Area’.  There is an easy solution to this – the GIS professional building this map can establish what are called ‘field alias’ names – a human-friendly nickname for each of the information fields.  ATTRIBUTE can be displayed as ‘Wetland Attribute’, OBJECTID can be displayed as ‘Wetland ID’ and SHAPE_Area can be displayed as ‘Wetland Area’.  This naming convention issue usually reflects the fact that GIS professionals with little cartography experience compiled the data for use in the Viewer.  (If I seem to be nit-picking here it is because I build maps for a living using this same technology.  I know these are issues that are easy to fix and should have been taken care of before the Viewer was opened up to the public.)

These shortcomings aside, the National Map Viewer is pretty darned good.  I’d say the USGS gets a good solid ‘B’ for this effort.  If they’d improve the damned printing issue I’d give them an ‘A’.

– Brian

Terrain Analysis

Last week I stumbled across this gem on YouTube –

It is a slightly dry film put out by the US Geological Survey in 1955 showing the modern (for the time) processes developed for natural resource analysis using aerial photography.

The guy narrating it sounds about as excited by his work as a dry goods salesman discussing the newest laundry soap.  Zzzzzzzzz…

But once past the dry narration I was interested by the methods demonstrated for geological, hydrological, soils and forestry analysis.  What struck me was that these were the precise methods we were taught at the Defense Mapping School as late as the early 1990s.  These photo analysis processes formed the basis for what we called Terrain Analysis, and in fact my job title for much of my Army career was Terrain Analysis Technician (MOS 215D).

This film approaches each type of analysis as an independent process – an end in itself.  We carried the analysis to the next level and merged the output from each of these four disciplines, mixed in some military-specific data like vehicle off-road capabilities, tossed in some road network analysis, some urban analysis and a pinch of weapon systems analysis and produced what we called a military terrain analysis.  Our products were usually delivered in the form of map overlays known as a combined obstacle study.  The process was very labor intensive and usually tightly focused on specific geographic areas like the Fulda Gap in Germany or the Koksan Bowl in Korea, natural movement corridors that had been used by armies for centuries.

Soldiers going into the Army’s Terrain Analysis field received extensive training in field identification methods like geological and soils analysis, hydrological analysis and route engineering studies.  They were taught to observe, test and measure in the field using a variety of hands-on methods.  Next they moved to the classroom and were taught advanced aerial photo analysis techniques and applied their field knowledge to what they saw in the photos.  It was hours and hours of peering at photos through stereoscopes, analyzing texture, tone and pattens to develop a detailed analysis of the terrain and it’s impacts on military operations.

Computers have taken on the burden of much of this analysis, and today you can feed a digital image into a sophisticated image analysis package like ERDAS Imagine and have it analyze huge swaths of territory in a small fraction of the time it took using the old manual methods shown in the film.  Still, it is fun to see how things were done in the good old days when men were men, hardhats were made out of aluminum and the science of aerial photo analysis found new applications in the civilian and military worlds.

Happy Birthday USGS

Missed it by a day, but Happy Birthday to the US Geological Survey!

The USGS was established on 3 March 1879, almost as an afterthought in a Federal budget submittal. It’s stated mission was “classification of the public lands, and examination of the geological structure, mineral resources, and products of the national domain.”

The first part of that mission, “classification of the public lands,” was what drove a lot of the USGS’s early efforts.  The US had acquired a lot of land as the result of the Louisiana Purchase and the Mexican War, but we didn’t have a very good picture of just what it was we had gotten our hands on.  The USGS launched a standardized mapping effort that continues to this day, and will never really be completed.  Mapping the United States is like painting the Golden Gate Bridge, as soon as you finish at one end it’s time to go back and start again at the other.

I’m hard pressed to name another federal agency that has done so much good work for both the nation as a whole and its citizens.

So here’s the the US Geological Survey. Happy one hundred and thirty second birthday!

Maps, Maps and More Maps

I want to place this post under the subcategory of “Best Use Of My Tax Dollars.”

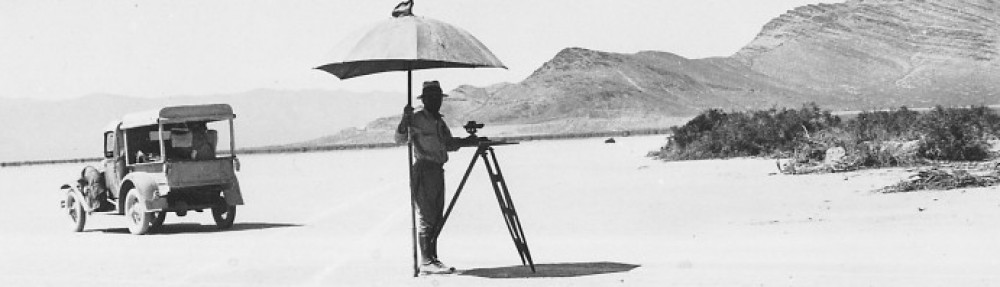
The US Geological Survey (USGS) has the stated mission of mapping the United States. That was one of the foundational roles of the USGS, and it is a role they took on with an almost missionary zeal from the beginning (the USGS was created in 1879 by act of Congress).

USGS set the standard for large scale (i.e., small area) mapping, and their 1:24,000 series topographic maps of the United States are classics.  These are the 7.5′ x 7.5′ quadrangle sheets, commonly known as ‘quads’.  These quad sheets have been used to teach generations of Americans the basics of map reading, terrain association and land navigation.  They have guided millions of hikers,  orienteers, foresters, researchers, explorers, search and rescue personnel, hunters, fishermen, campers and canoers for over 100 years.  USGS maps have, literally, served as the background to America’s love of the outdoors and her expansion and growth across three centuries.

In the old days about the only way to get USGS topographic maps was to order them directly from the USGS or purchase them from a limited number of authorized sales outlets like camping supply stores.  You can still do that if you like – a single USGS 1:24,000 map will run you about $8.00.  Not cheap, but not bad for a high quality map printed via lithographic processes.

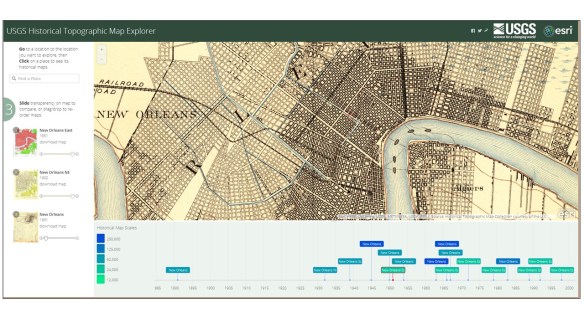
But this is the age of the World Wide Web, instant gratification and free data.  The USGS has happily obliged us by putting virtually its entire inventory of topographic map products – at all scales – on line for instant download.  The USGS online store offers an easy to use map search function under the Map Locator link.  You can search for a particular map by address, place name or simply by picking a point in the map in the Google Map window.  Using this process you can either purchase the paper map or download a free digital copy.  The free digital map is a scanned copy of the original paper map in Adobe PDF format.  The scan quality is good – not as good as the original paper map, but pretty darned good for a free product.  These maps can be opened and read using the free Adobe Acrobat Reader application.

As an added bonus these maps are delivered in GeoPDF format.  This means that the geographic extents of the map have been embedded into the digital map file.  If you want to take advantage of this geospatial functionality you can download the free TerraGo Technologies plug-in for Acrobat Reader (available from a link on the USGS Map Store website).  With this plug-in you can set the coordinate system of your choice (i.e., latitude/longitude, UTM, etc.) and select coordinates for features of interest, measure distance and area, measure azimuths and, if you have a compatible system you can link these digital maps to your GPS and use them as your navigation background.

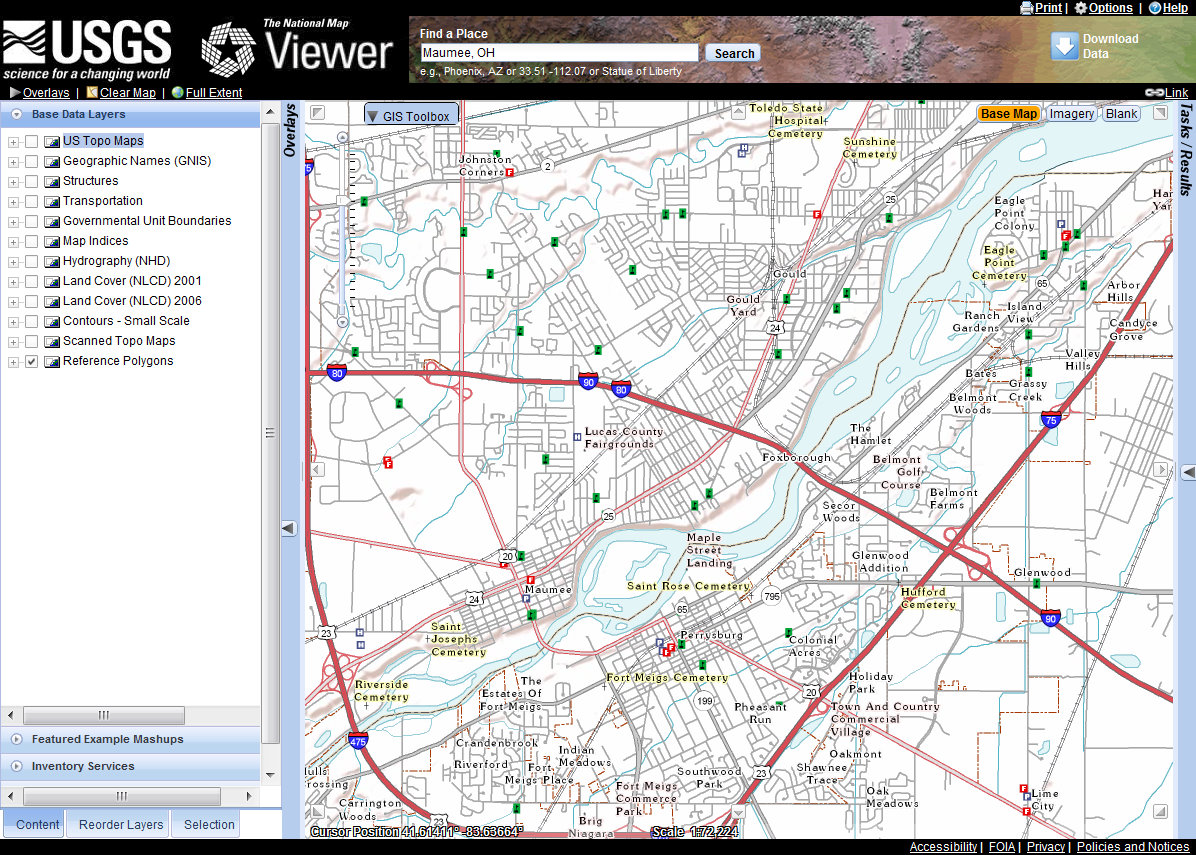
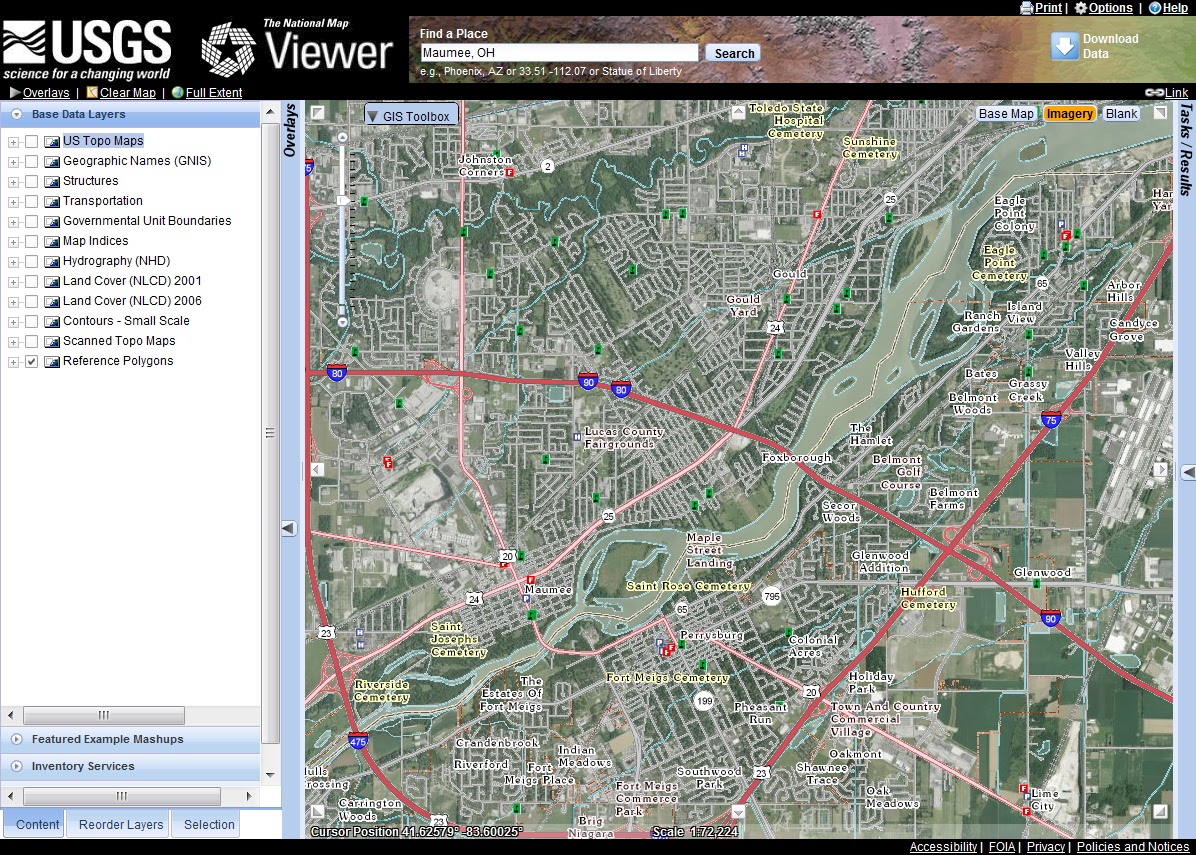
But it gets even better!  The functionality I just described is specific to the old generation of scanned paper maps.  The USGS is producing an exciting new generation of 1:24,000 quadrangle maps known as the US Topo series.  These maps have the same geographic extents as the traditional quadrangle maps, but instead of being created by traditional cartographic methods the US Topo series are created using aerial imagery or satellite imagery as the map background.  This allows maps to be produced and updated much faster than the old traditional cartographic methods allowed.  In many places of the US the traditional quad sheets have not been updated for over 50 years!  The technology behind the new US Topo series of maps allows for much faster updating.  As an added bonus (I think I’m starting to sound like Billy Mays here), since the US Topo maps began life as a purely digital file (they are created using a program called ArcGIS) the production process allows even more functionality to be embedded in the map file.  Users of US Topo series maps will be able to manipulate virtually all of the data embedded in the map, turning data layers on and off.  If you have a copy of Adobe Acrobat (not just Reader) you can make annotations directly on the map, adding comments, symbols and basic sketches.

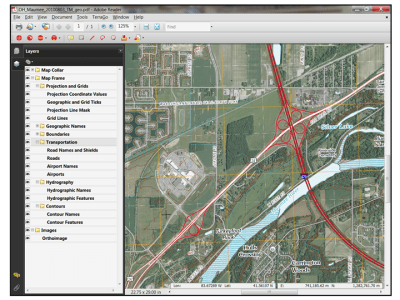
Zoomed in view of the US Topo map of Maumee, Ohio (my home town).
Using the table of contents on the left you can turn data layers on or off.
This map is focused on the site of the Battle of Fallen Timbers, where General ‘Mad’ Anthony Wayne
defeated the Indian tribes of the Western Confederacy in 1794, opening the old
Northwest Territories (Ohio, Michigan, Indiana) to American settlement.
The battle site is the large patch of woods in the center of the map image.

Bottom line – this is all good stuff, and it’s free.  Go get it!

Brian